Key Features :
01. Trend-Based Analysis with Stages and Background Colors
VIV breaks down the market into three color-coded stages based on trend confirmation:
![]() Uptrend (Short-Term Trend Confirmation)
Uptrend (Short-Term Trend Confirmation)
- Marks early accumulation or consolidation.
- Shows possible reversal zones.
- Short-term traders use this to spot opportunities before a breakout.
Uptrend (Medium-Term Trend Confirmation)
- Highlights the start of a strong directional move.
- Confidence zone for position building and breakout-following strategies.
Uptrend (Long-Term Trend Confirmation)
- Indicates long term strength.
These trend stages reflect the emotional phases of market participants and the shifting balance of power between buyers and sellers. You can toggle trend backgrounds for intraday, daily, weekly, and monthly trends and change their background colors.
Note : If the % difference inShort term trend exceeds 10%, the stock is considered extended. Such setups should be evaluated with caution before making any trade decisions.
![]()
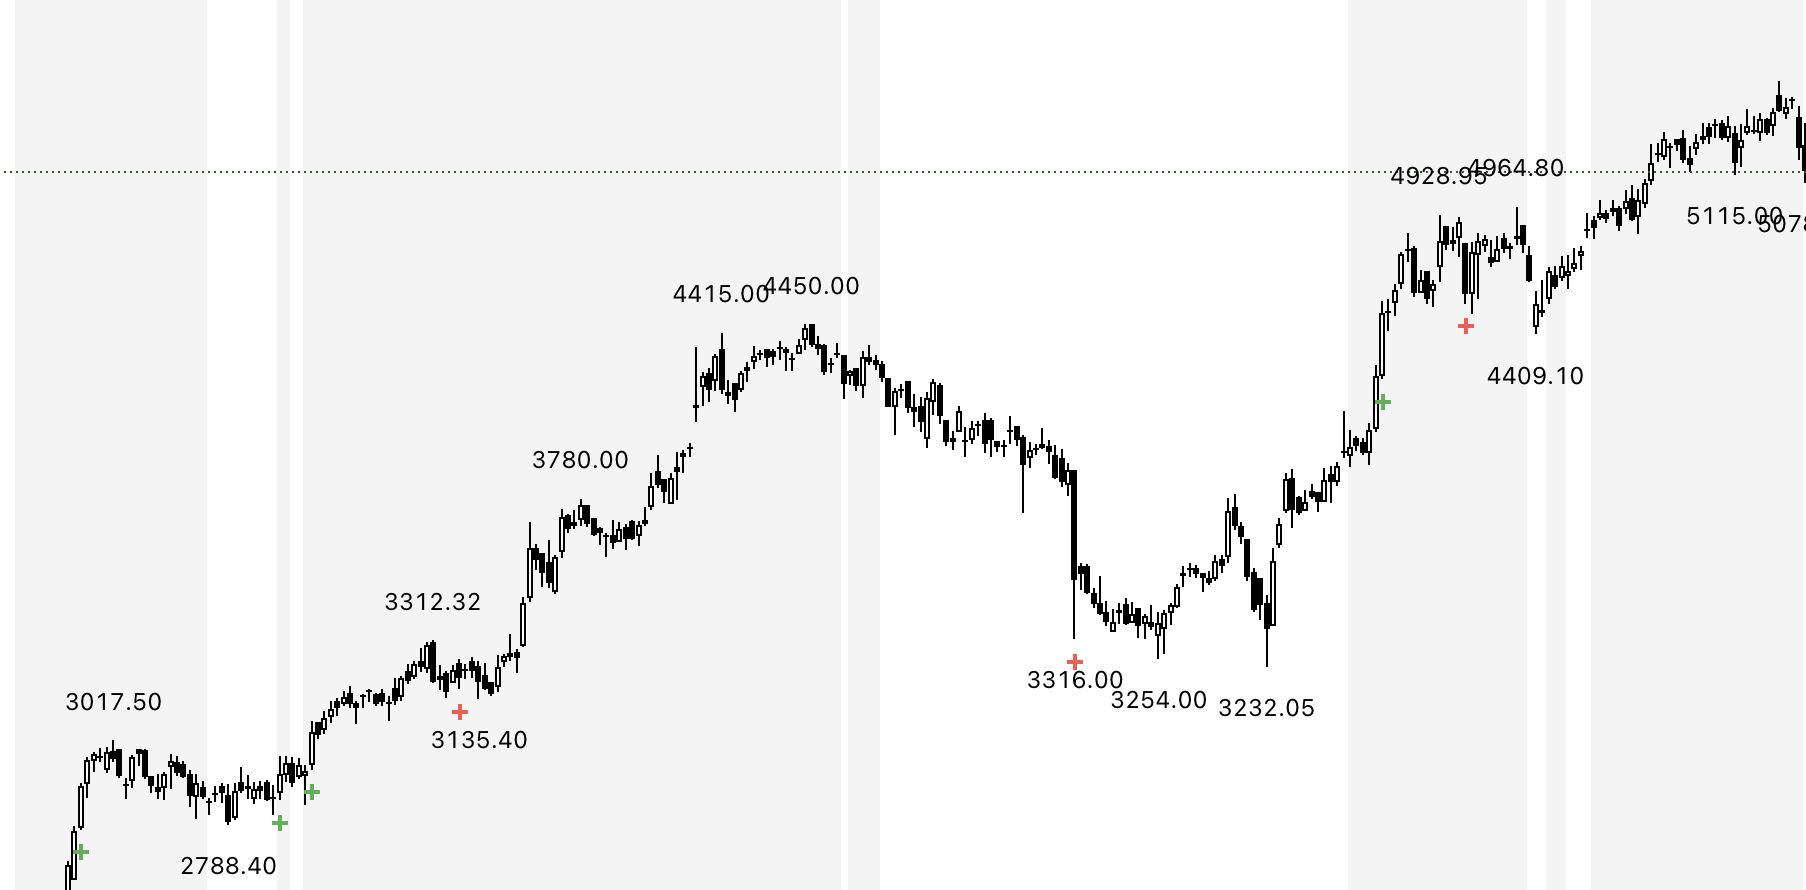
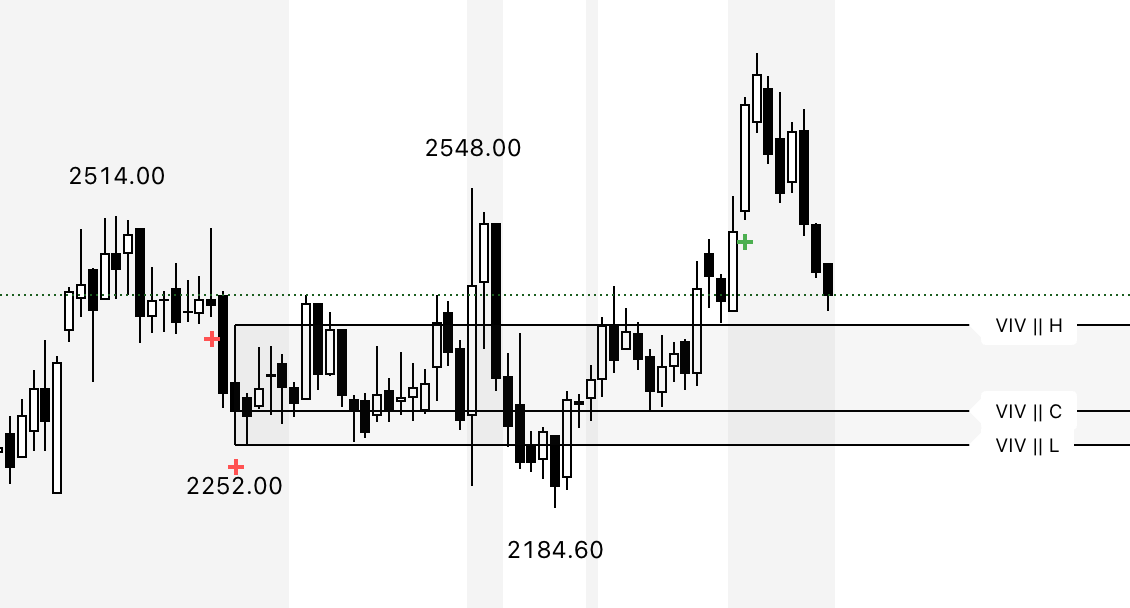
02. . Volume Footprints (➕ Signs)
VIV intelligently identifies past candles with high-volume activity (accumulation/distribution).
![]()
- These are not typical breakout volumes, but subtle footprints of smart money.
- Help spot reversal points, liquidity zones, and retest levels.
- Valuable for both breakout and reversal traders to confirm zone strength.
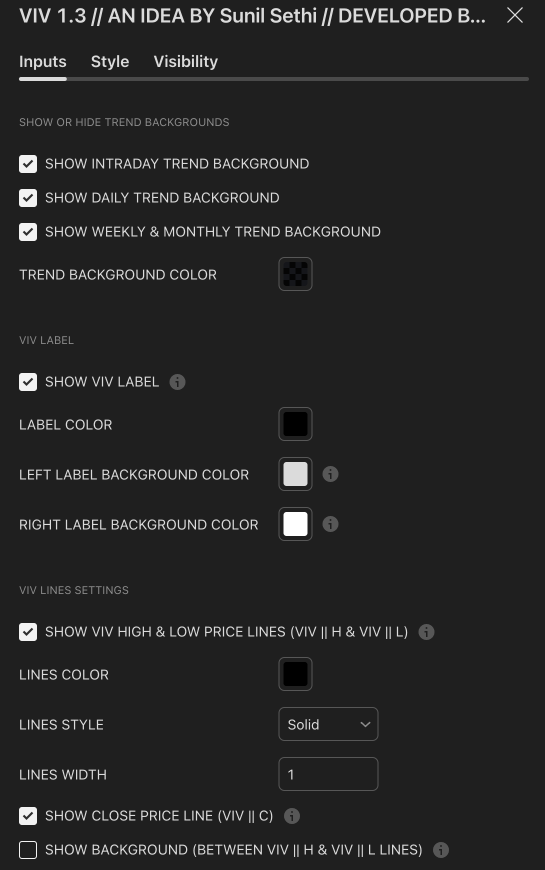
- You can enable or disable these lines, adjust color, style, and width via VIV Line Settings.
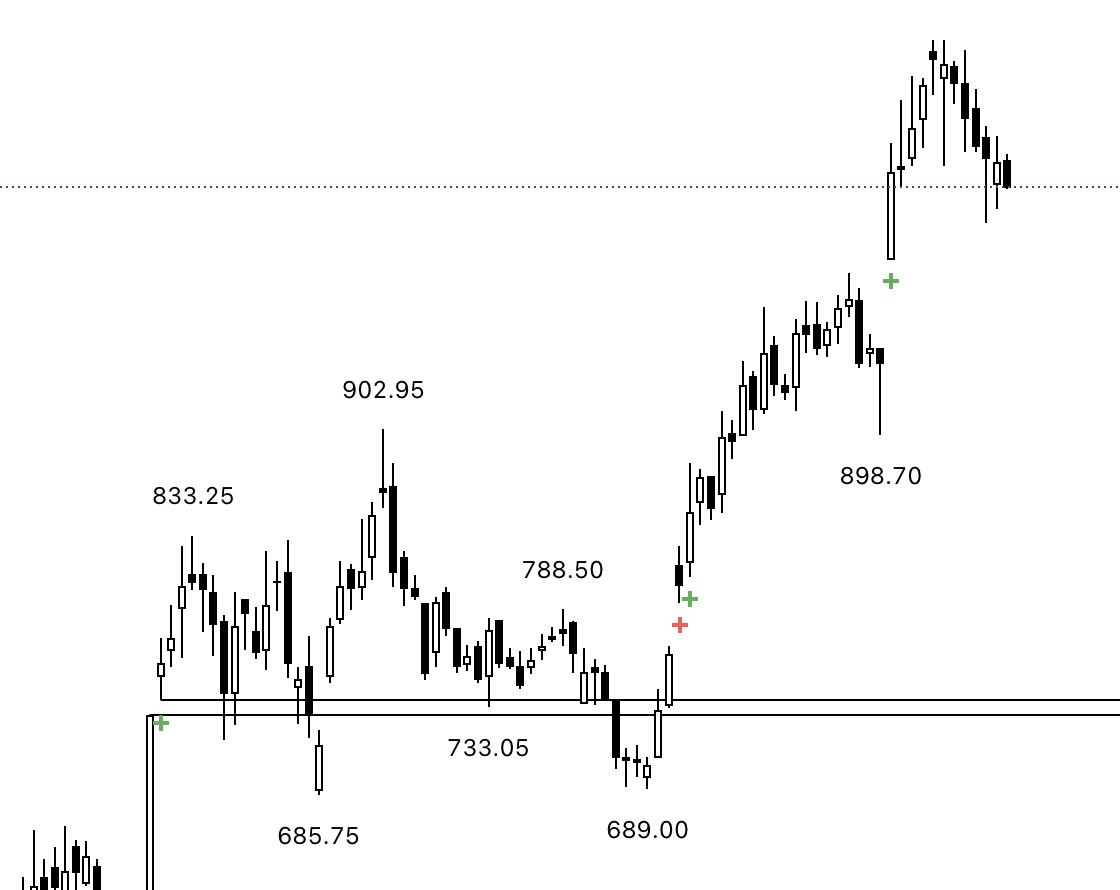
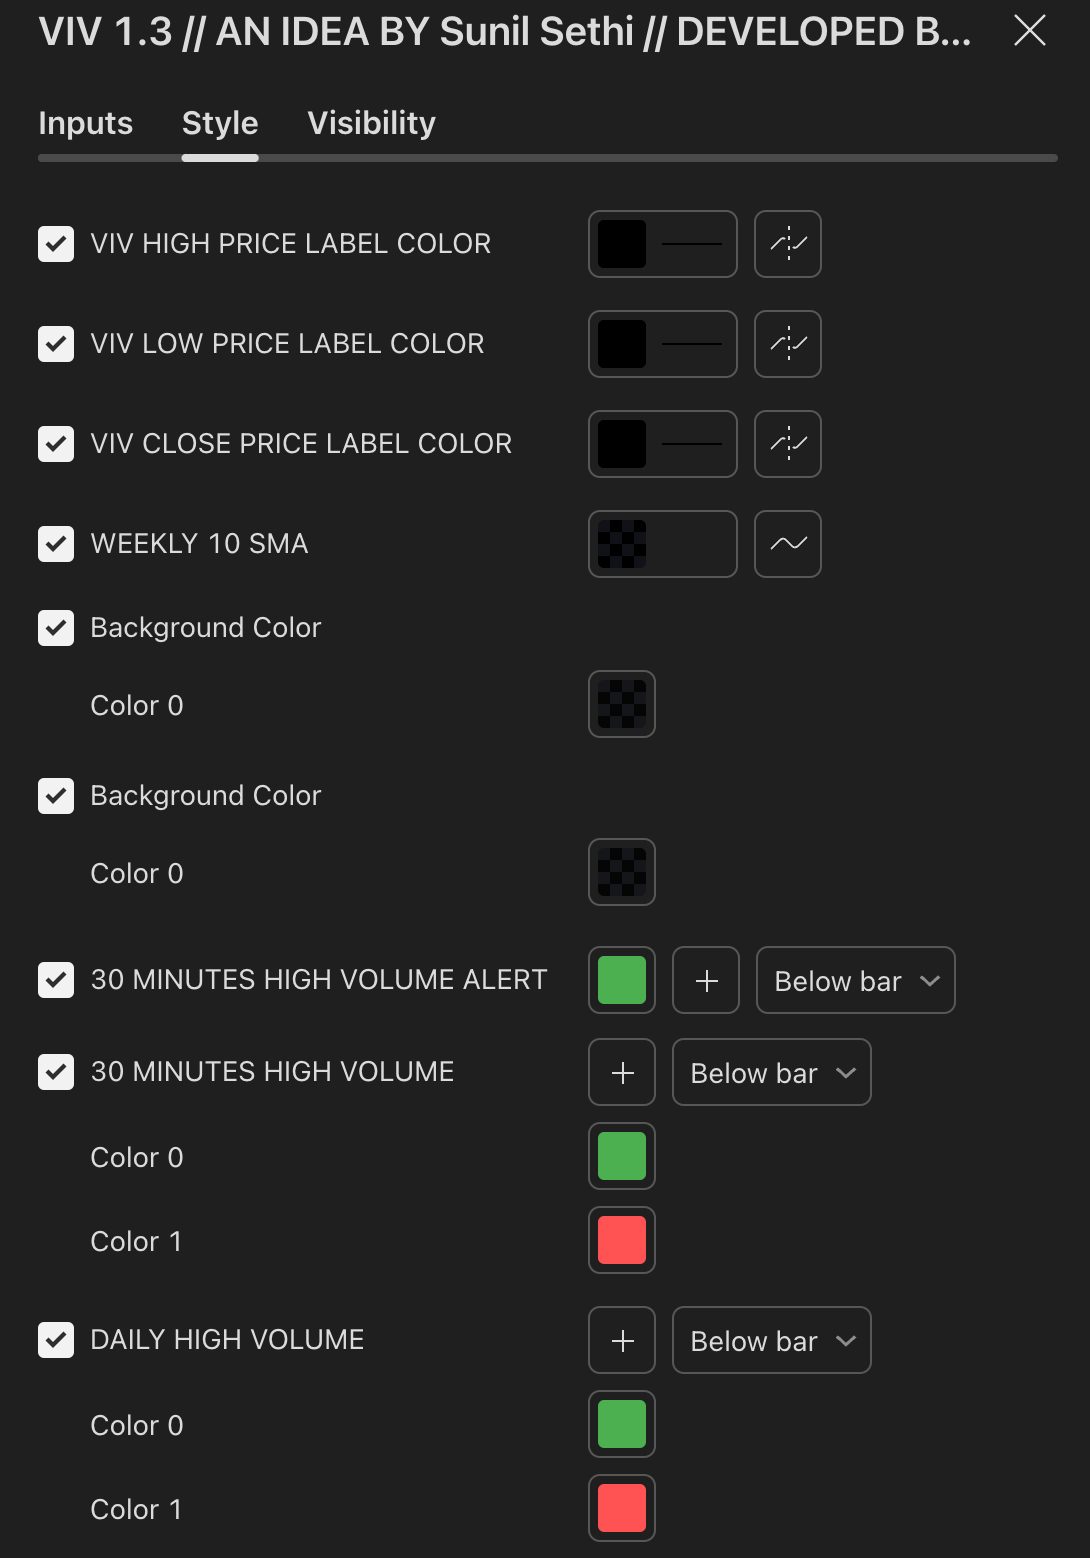
03. VIV || H, VIV || L and VIV || C Zones
Automatically plots horizontal levels from high-volume, high-activity candles—revealing the footprints of smart money.
- VIV || H (High) = Top of important bar.
- VIV || L (Low) = Bottom of important bar.
- VIV || C (Close) = Close price of important bar.
Key levels used by traders for:
- Entries
- Stop-loss placement
- Targets
These zones show where price historically reacted due to strong institutional presence. They come with customizable label colors and backgrounds.
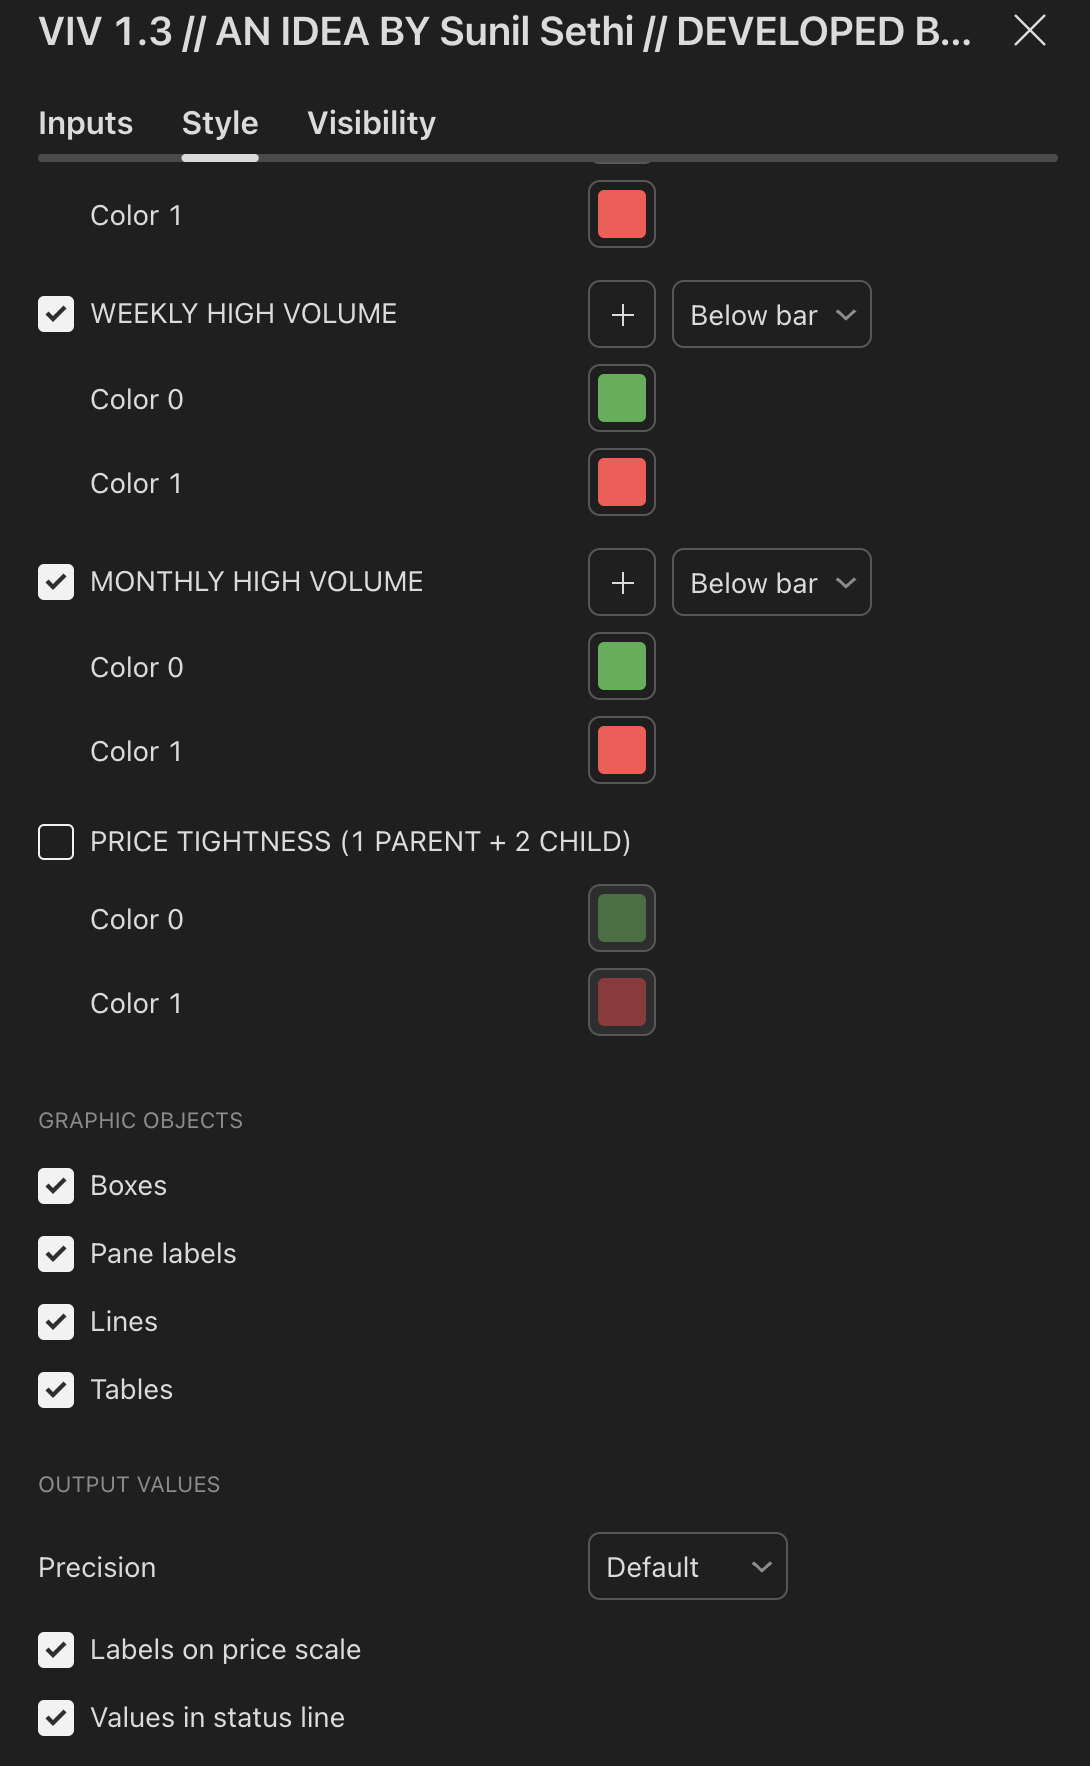
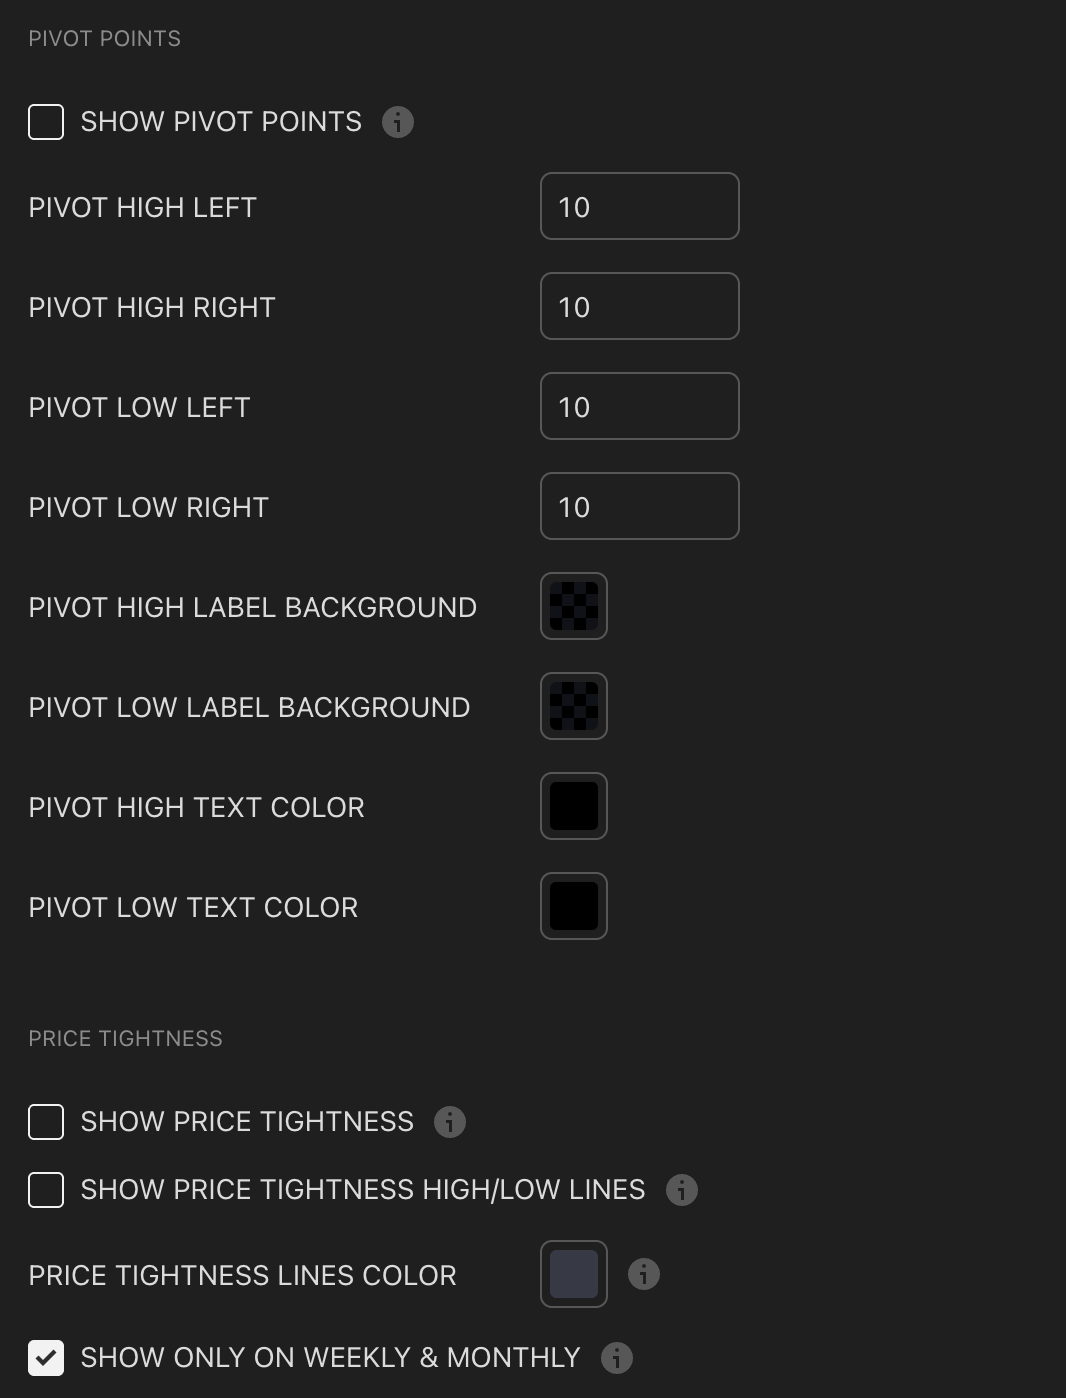
04. Price Tightness Detection
Detects when two or more candles compress within the range of a larger parent candle.
Represents indecision, contraction, or coiling behavior before major price moves.
Ideal for both:
- Breakout traders looking for base formations.
- Reversal traders watching for exhaustion.
Color-coded markers indicate such tight price zones — disabled by default but can be enabled.
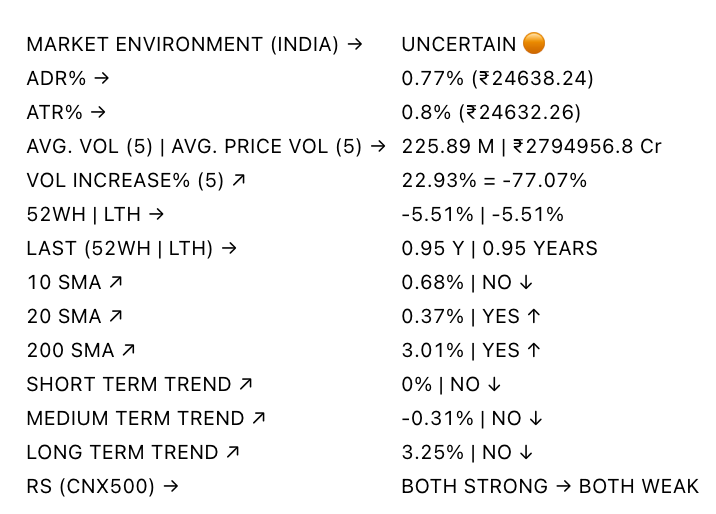
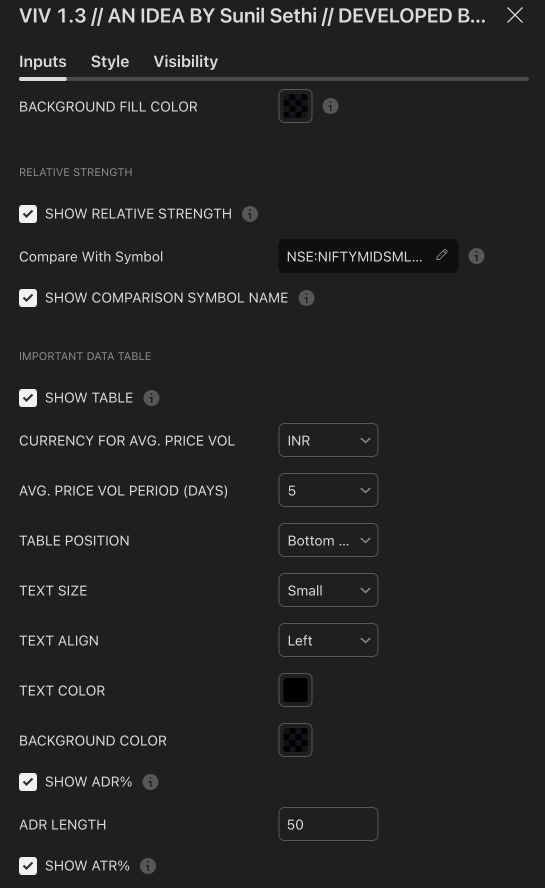
05. Technical Stats Panel (Important Data Table)
An insightful dashboard providing:
- Most important - Market environment
- ADR% – Volatility-based movement expectations (change period via input).
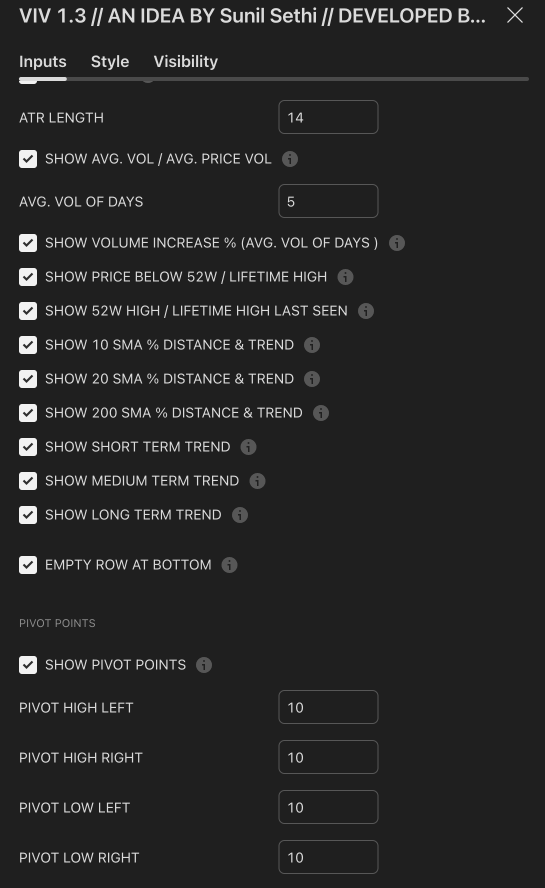
- ATR – Real volatility indicator.
- Average Volume / Price Volume – Customizable average period and currency unit (INR/USD).
Trend Data:
- 10/20/200 SMAs
- Trend stages (Daily/Weekly/Monthly)
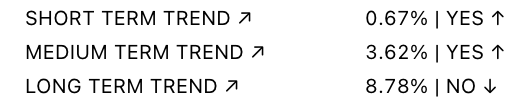
Relative Strength vs Benchmark
![]()
- RS grade: GREAT, GOOD, FAIR, UNCERTAIN, UNDER PERFORMER, LAGGARD, POOR
- When RS is comparing: BOTH STRONG, BOTH WEAK
- You can also display the benchmark symbol name and change the symbol for relative strength comparison.
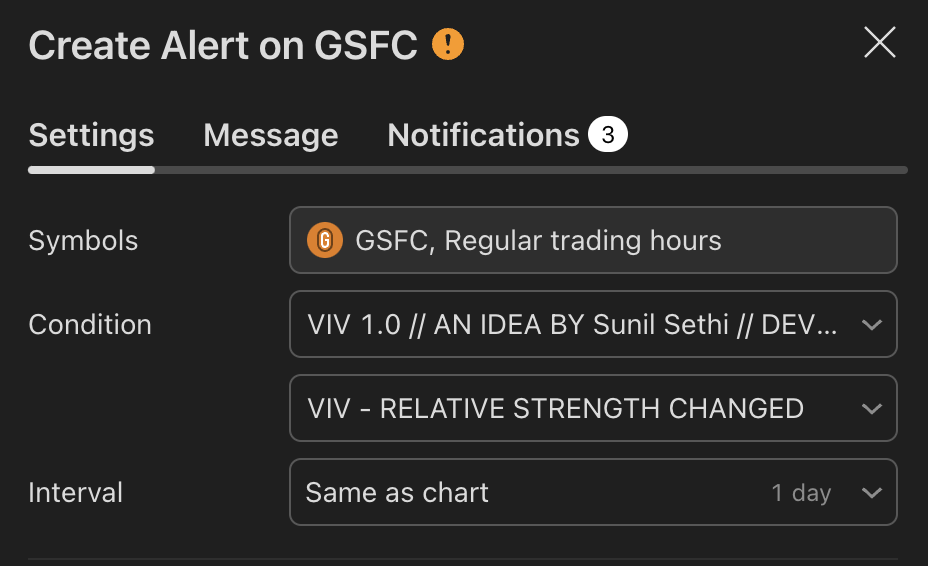
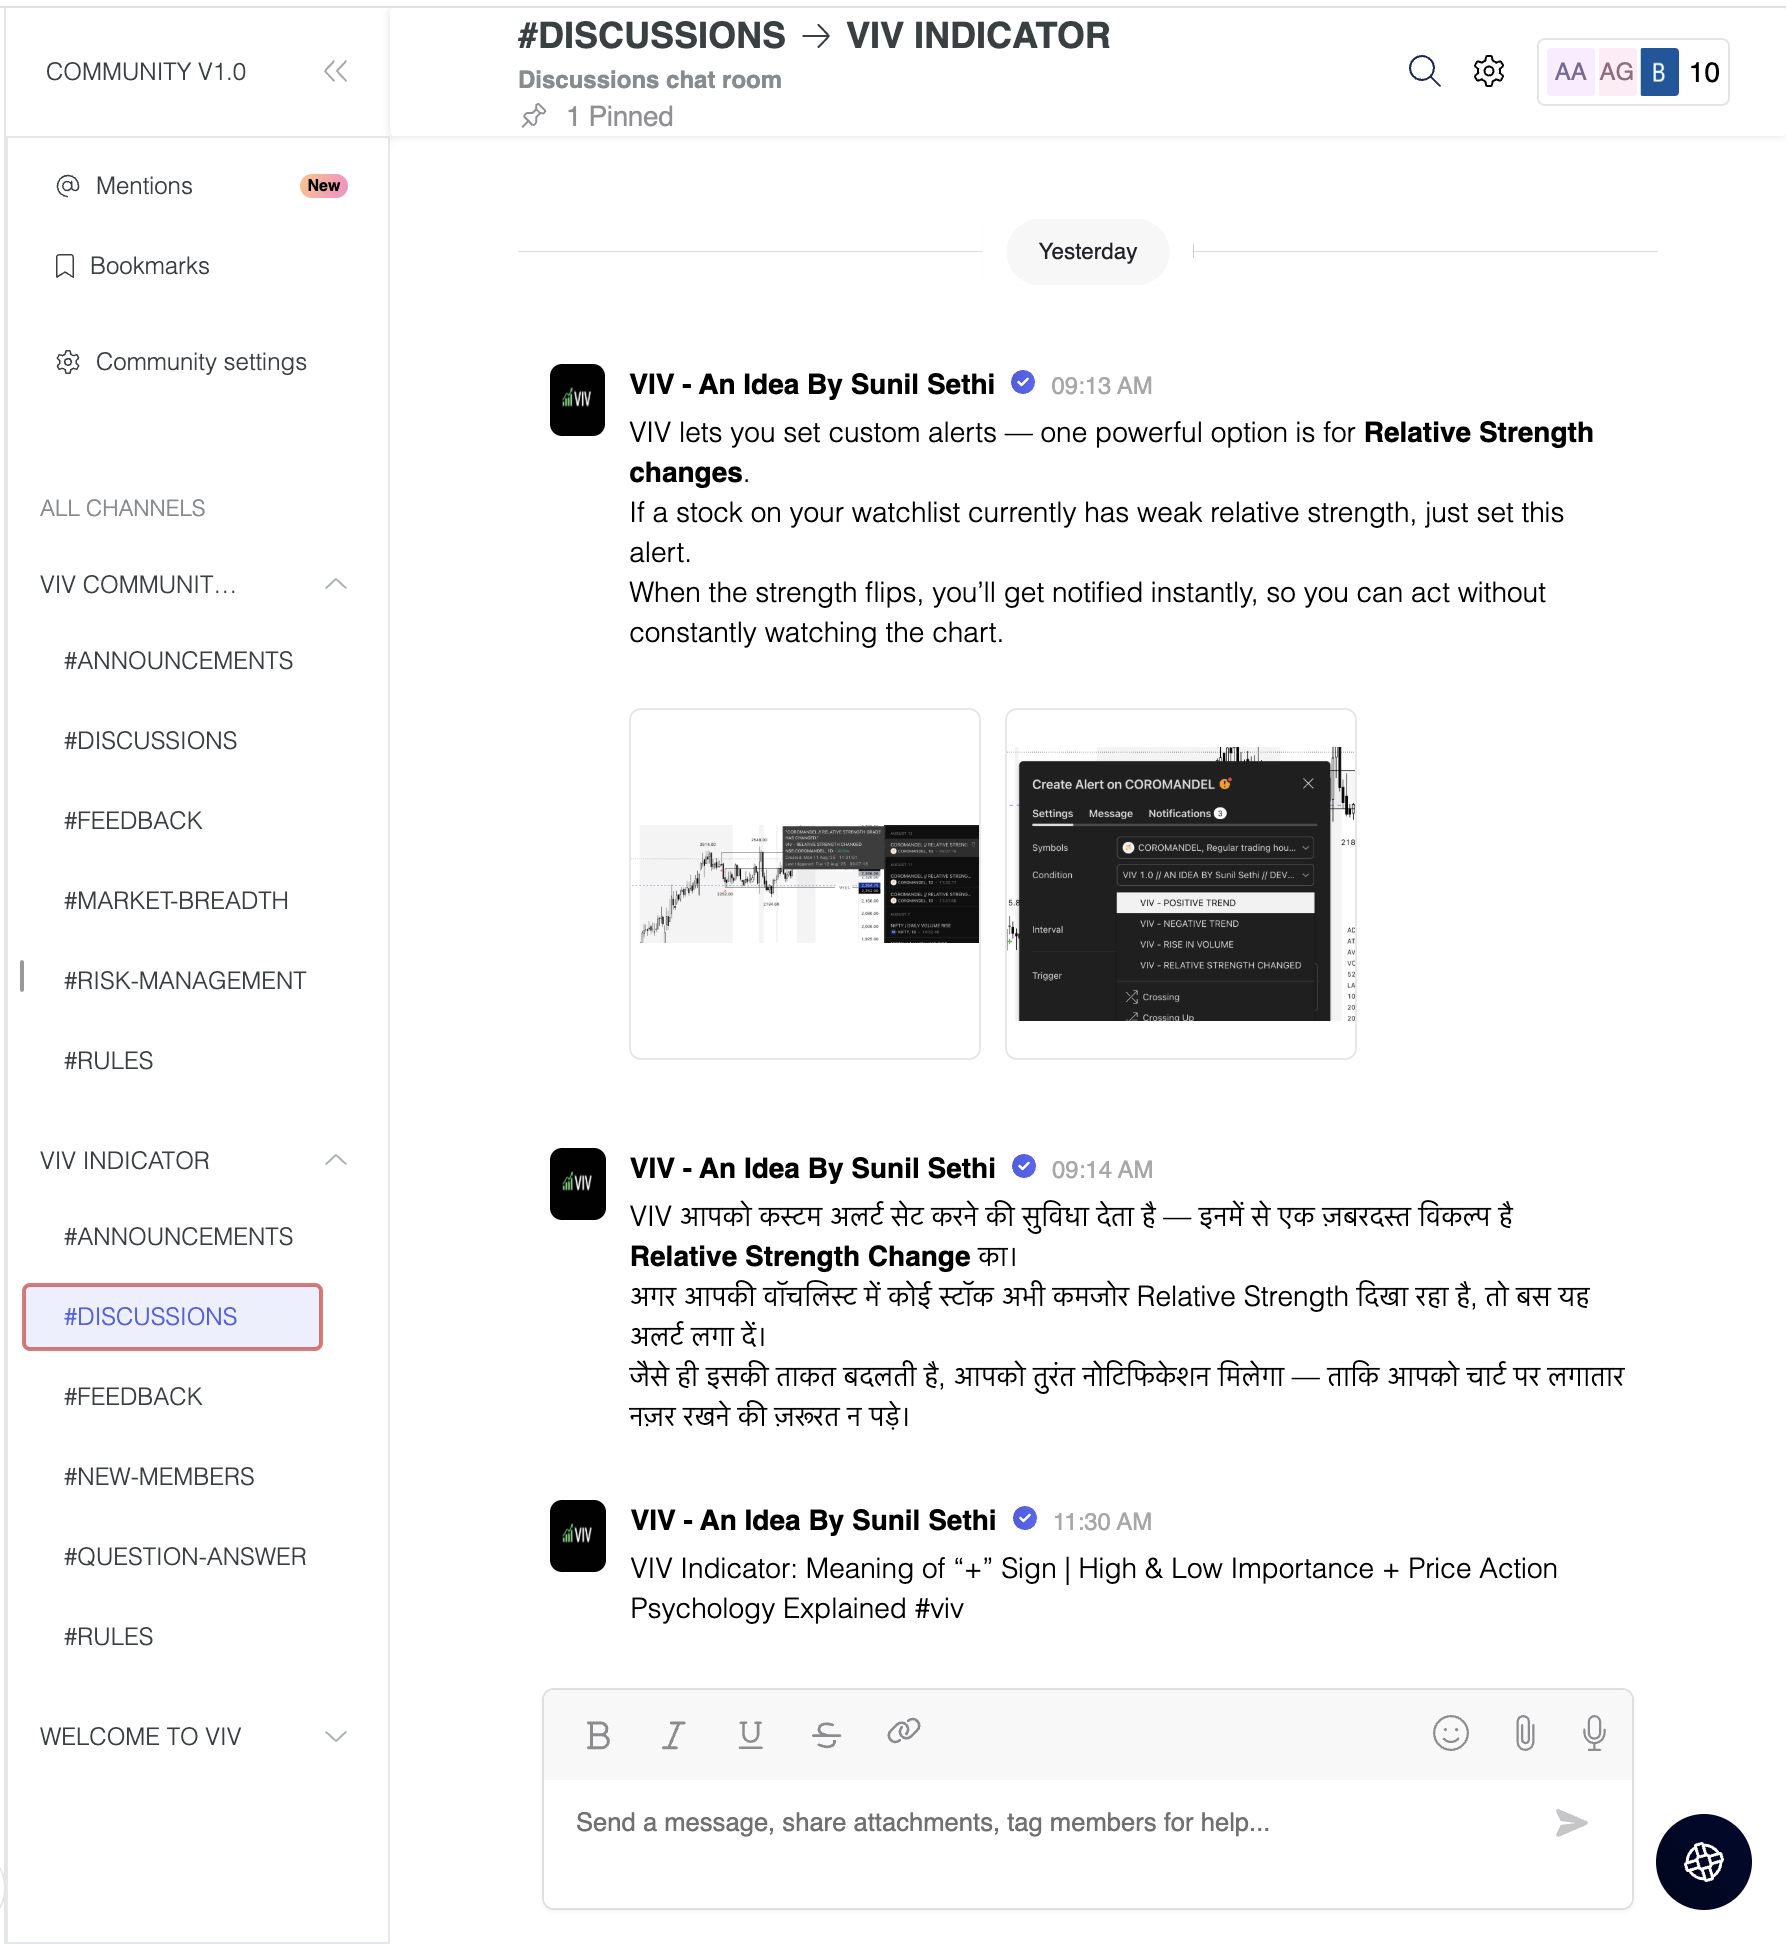
06. Relative Strength Grade Change Alerts
VIV tracks relative strength changes against a chosen benchmark (e.g., Nifty MidSmallCap).
![]()
The above tells us that if the stock is stronger or weaker than the benchmark.![]()
- Detects when relative strength shifts from:
- Strong → Weak (e.g., EXCELLENT → GOOD → FAIR)
- Weak → Strong (e.g., LAGGARD → POOR → FAIR → GOOD)
- Sudden transitions (e.g., WORST → FAIR, BOTH WEAK → GOOD, BOTH GOOD → POOR)
- BOTH WEAK → GOOD or BOTH GOOD → POOR means stock's strength is better/poor than the benchmark
- and more.
These alerts can help in:
- Early trend following
- Exiting when RS degrades
- Adding positions when RS improves
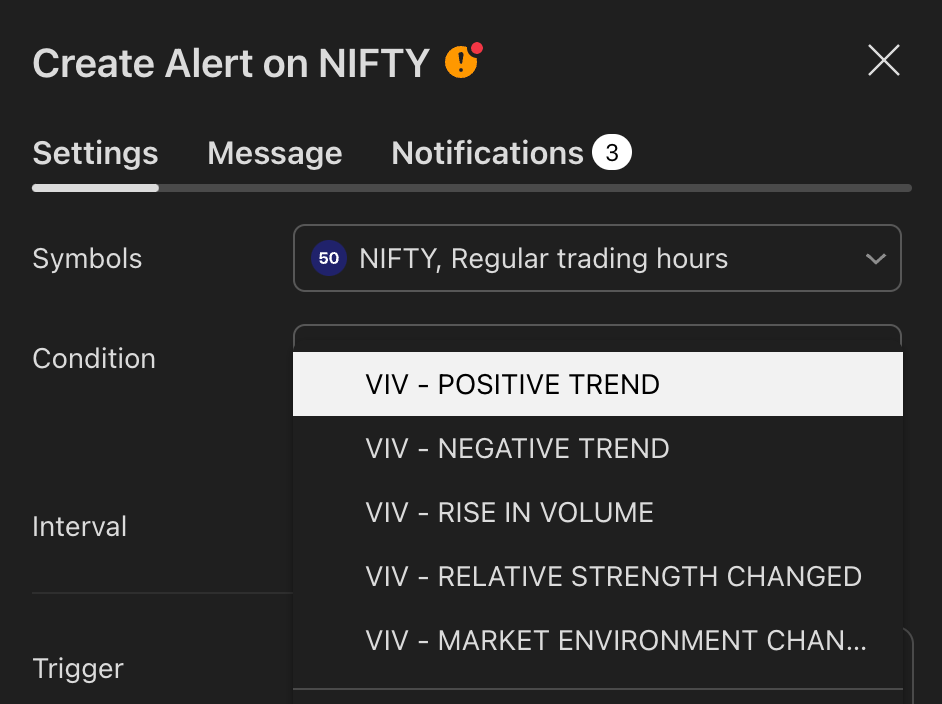
07. Smart Alerts (Built-in Conditions)
You can set alerts for (any timeframe)
- Positive Trend
- Negative Trend
- New Footprint (+)
- Change in Relative Strength
- Change in market environment
Set your preferred interval and trigger type in TradingView to stay updated without chart-watching.
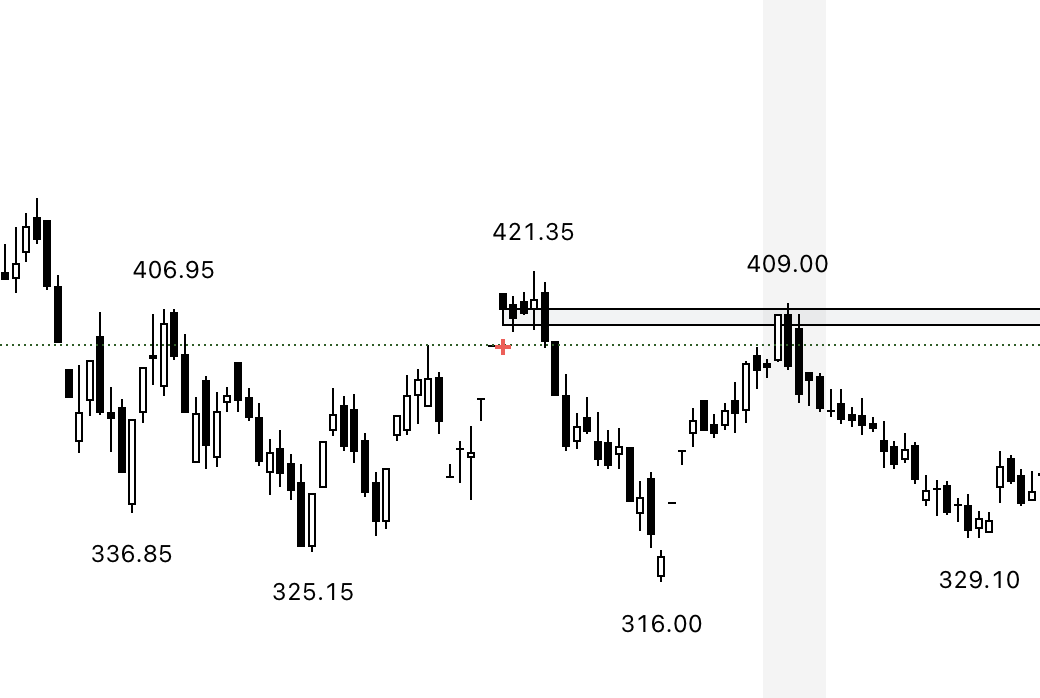
08. Pivot Points
VIV allows visualizing pivot highs and lows using a dynamic window (left/right lookback).
![]()
- Customizable label text and background color.
- Helpful in identifying support or resistance zones and breakout points.
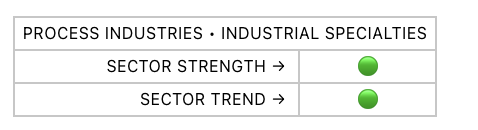
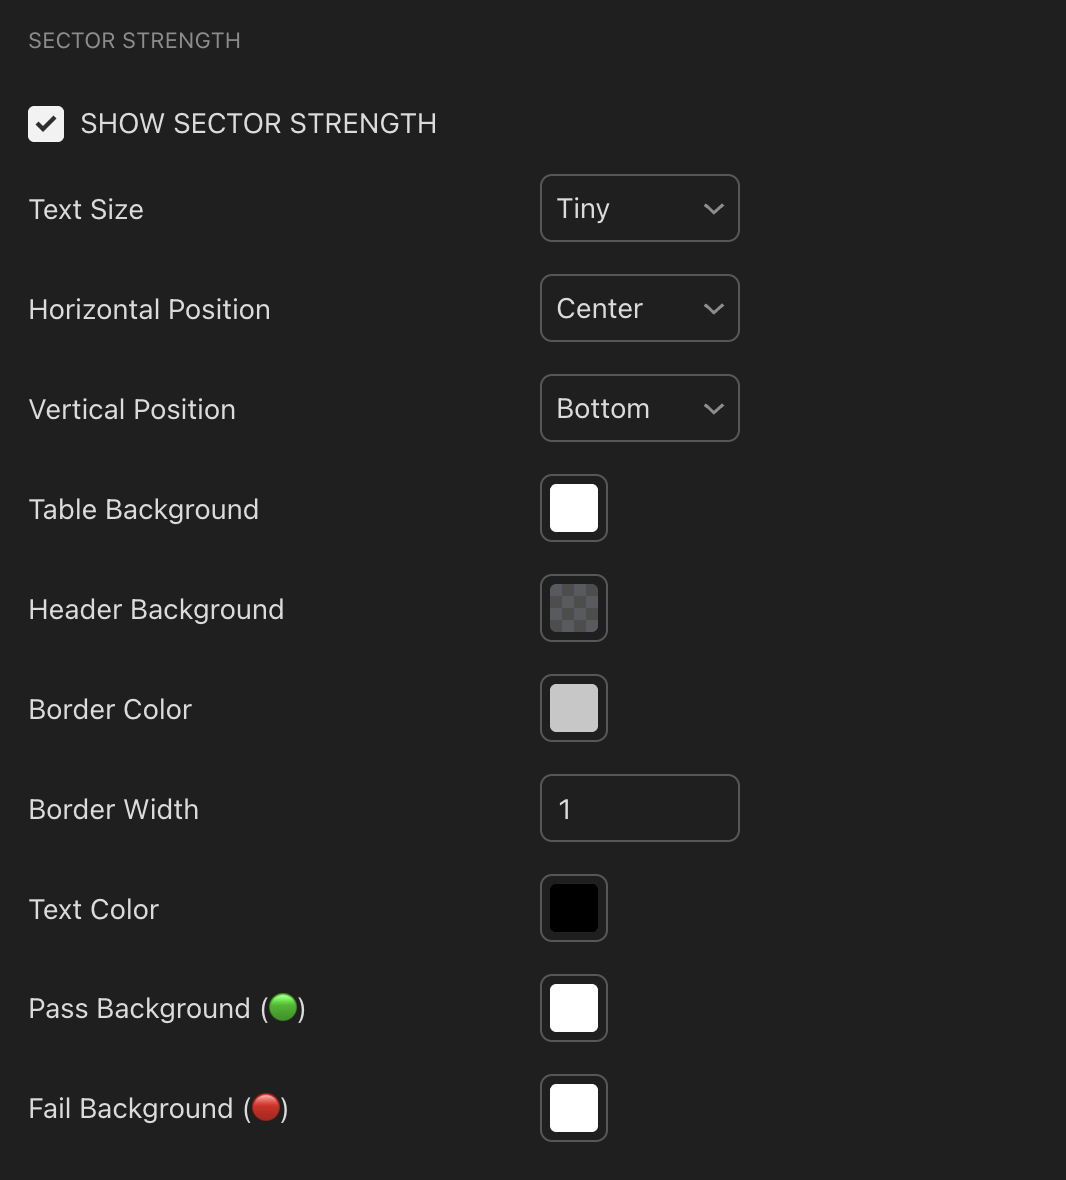
09. Sector Strength & Trend Insight
![]()
This feature shows the
real-time strength and trend direction of a stock’s sector, helping you quickly understand whether the stock is moving
with sector tailwinds or against them.
- Sector Strength indicates whether the sector is outperforming or underperforming.
- Sector Trend confirms if the sector’s broader direction is supportive or weakening.
Use this to
avoid strong stocks in weak sectors, identify
leaders within strong sectors, and improve decision quality by aligning individual trades with
sector-level momentum.
10. Customization Options
- Labels
- Zones
- Trend backgrounds
- Table text, borders, and alignment
- Adjust visibility per timeframe (inputs tab)
How to Use VIV Effectively
- Use trend background colors to identify phase (base, uptrend, top).
- Look for short, medium and long term trend in the technical panel (Bottom right of your chart).
- Watch for old high-volume candles (➕ marks) to plan entries/exits.
- Trade around ➕ marks, VIV || H or VIV || L or VIV || C levels.
- Use tight price zones to anticipate explosive moves.
- Monitor table for ATR/ADR, RS grade, and moving averages.
- Use alerts to automate monitoring of trend, volume, or RS shifts.
Best Suited For:
- Reversal traders (demand/supply based)
- Breakout traders using base-building logic
- Systematic or discretionary traders
- Anyone who values price-volume behavior over lagging indicators
Add-on:
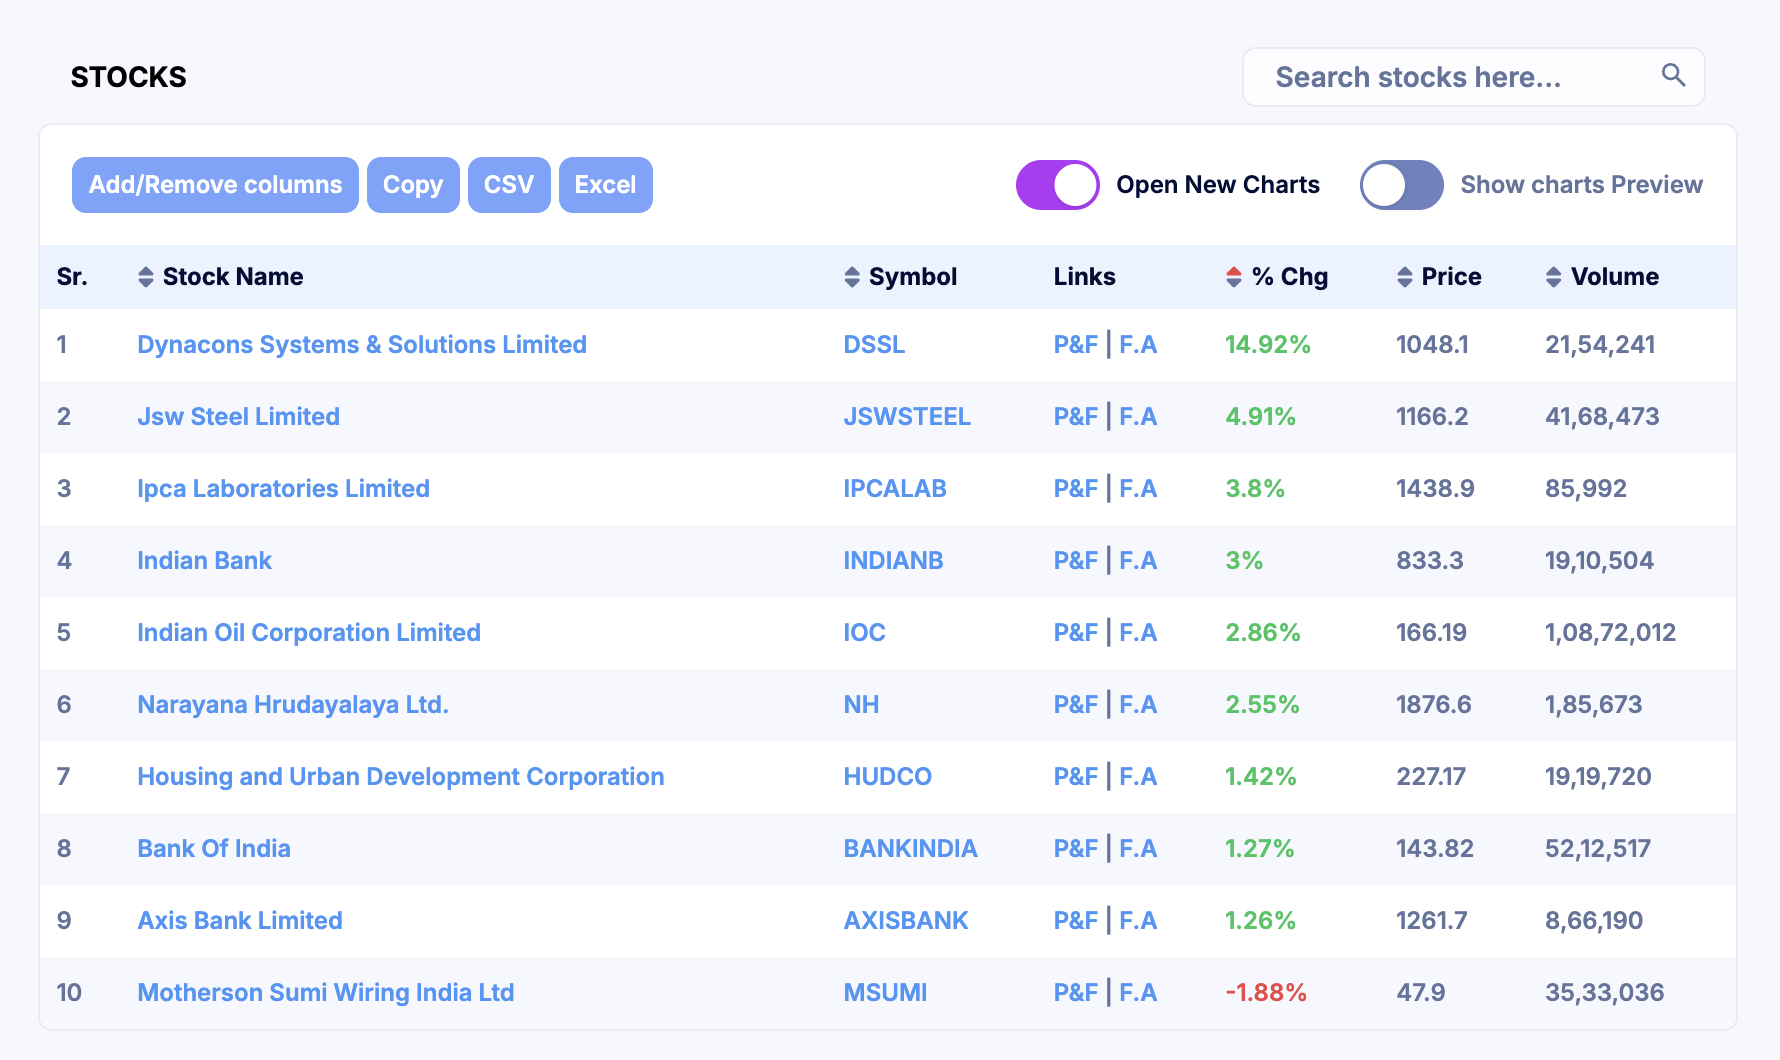
The VIV Community Add-on is designed to help you bridge the gap between scanning ideas and executing trades with proper risk management.
Members regularly share:
- Scanner outputs (Chartink-based, aligned with VIV logic)
- Live trade discussions
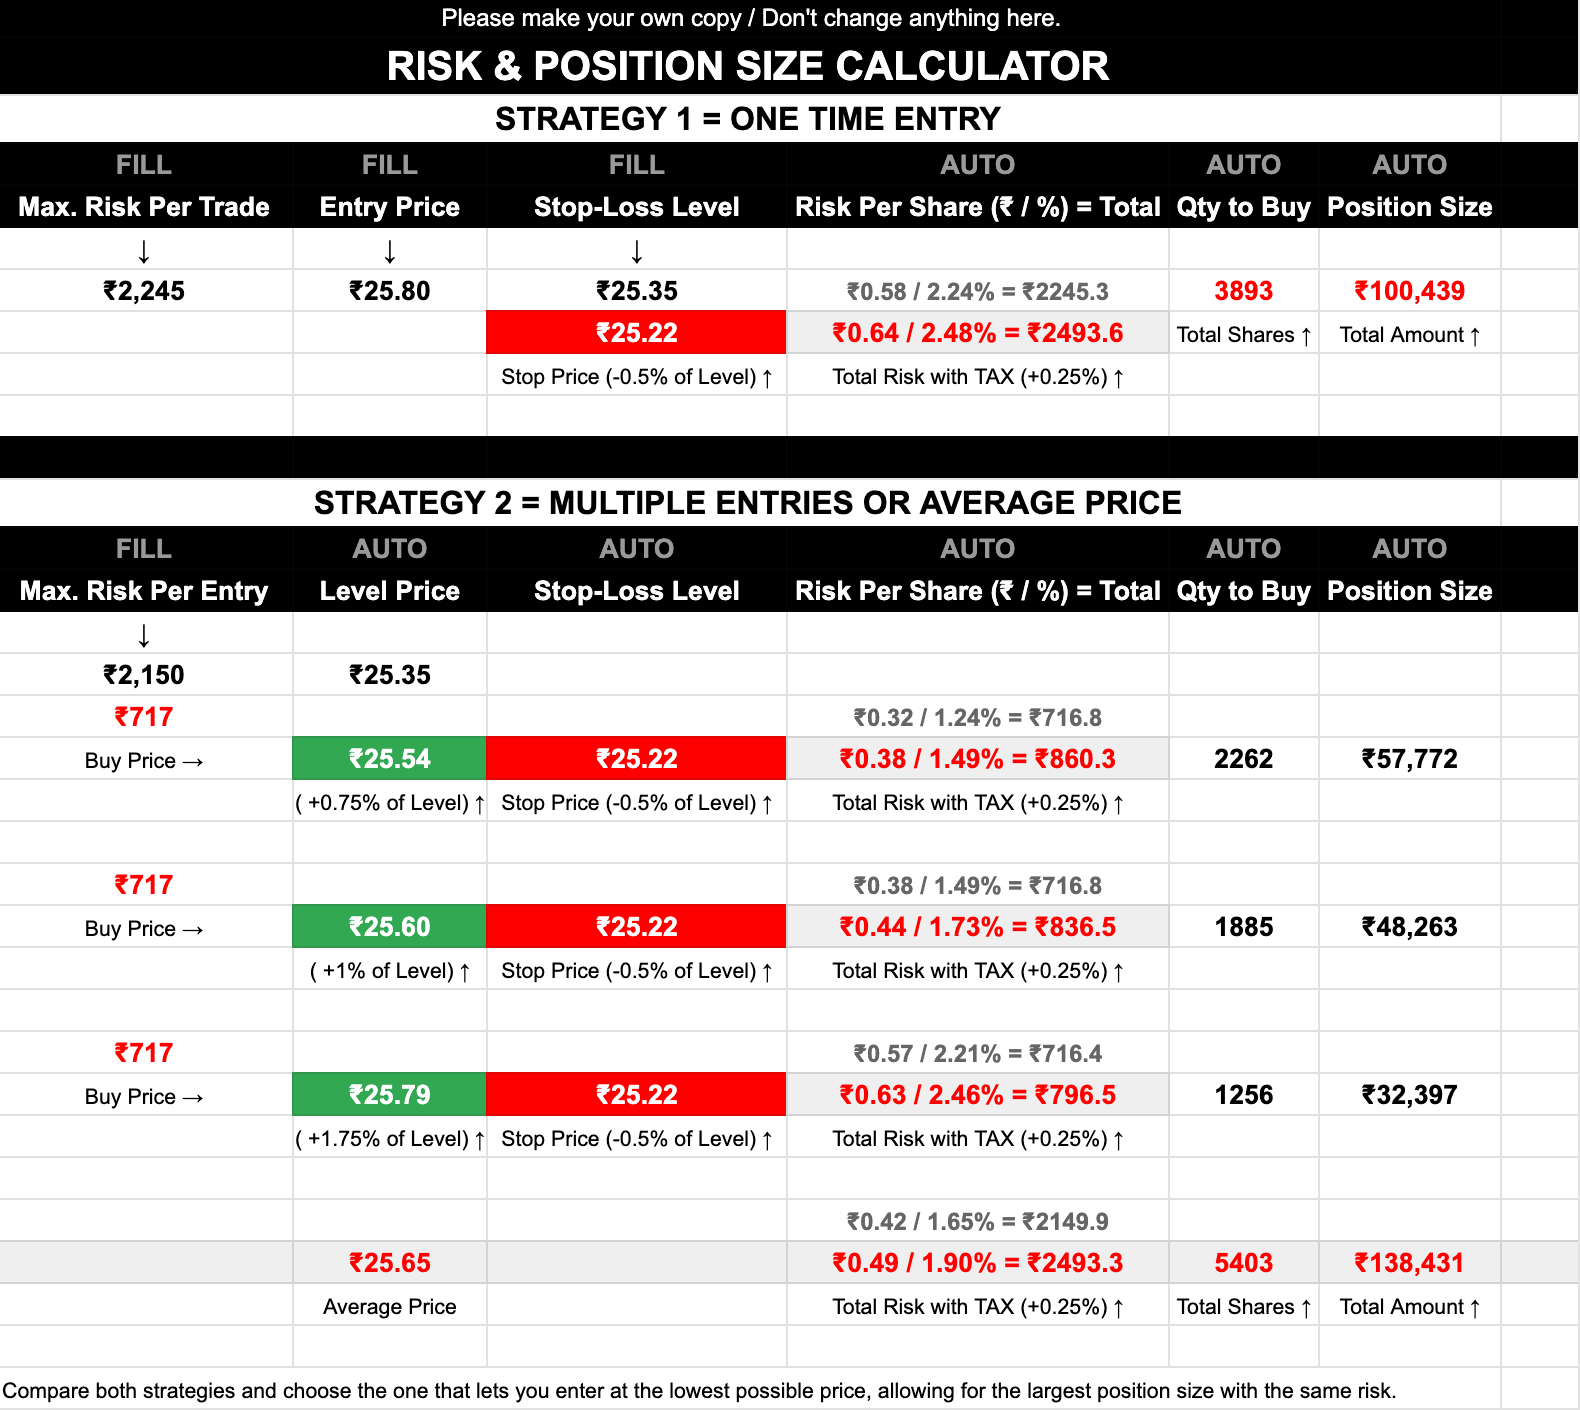
- Risk & position sizing using our predefined calculator.
- Learning posts on price action, volume footprints, and trade management
Before taking any trade from the scanner or community discussion, always validate it using the VIV Risk & Position Size Calculator. This ensures:
- You stay within predefined risk
- Position size is adjusted automatically based on stop distance
- No single trade can damage your overall portfolio
The community add-on is not about tips — it’s about process, discipline, and execution, helping you think like a professional trader rather than reacting emotionally.
Join the VIV community →
![]()
![]()
![]()