There are no items in your cart
Add More
Add More
| Item Details | Price | ||
|---|---|---|---|

Most traders are trained to watch price — not what happens behind the price. They stare at candles, patterns, and breakouts, but the real story lies in the space between: the volume gaps — moments when price moves sharply on heavy participation and leaves footprints of institutional intent.
A volume gap is not just a price gap. It’s a sudden shift in participation — when one side (buyers or sellers) dominates the tape, causing a visible imbalance in both price and volume. These gaps often form:
Institutions don’t leave a note when they enter or exit — but they do leave footprints.
Here’s how you spot them:
 Not every big volume move means “smart money buying.” Sometimes, these are liquidity traps — institutions exiting while retail traders enter late. The difference lies in the context:
Here’s how experienced traders interpret volume gaps:
Here’s how experienced traders interpret volume gaps:
Because most indicators average out volume. Traditional oscillators blur the story by compressing spikes into smoothed lines. By the time a trader reacts, the smart money is already gone. This is why understanding raw volume action is critical — it’s the first signal of intent before price follows.
Volume gaps tell you where momentum shifted hands.
To use them effectively, treat them as decision zones, not just candles of excitement. Here’s how professional traders integrate them into their process: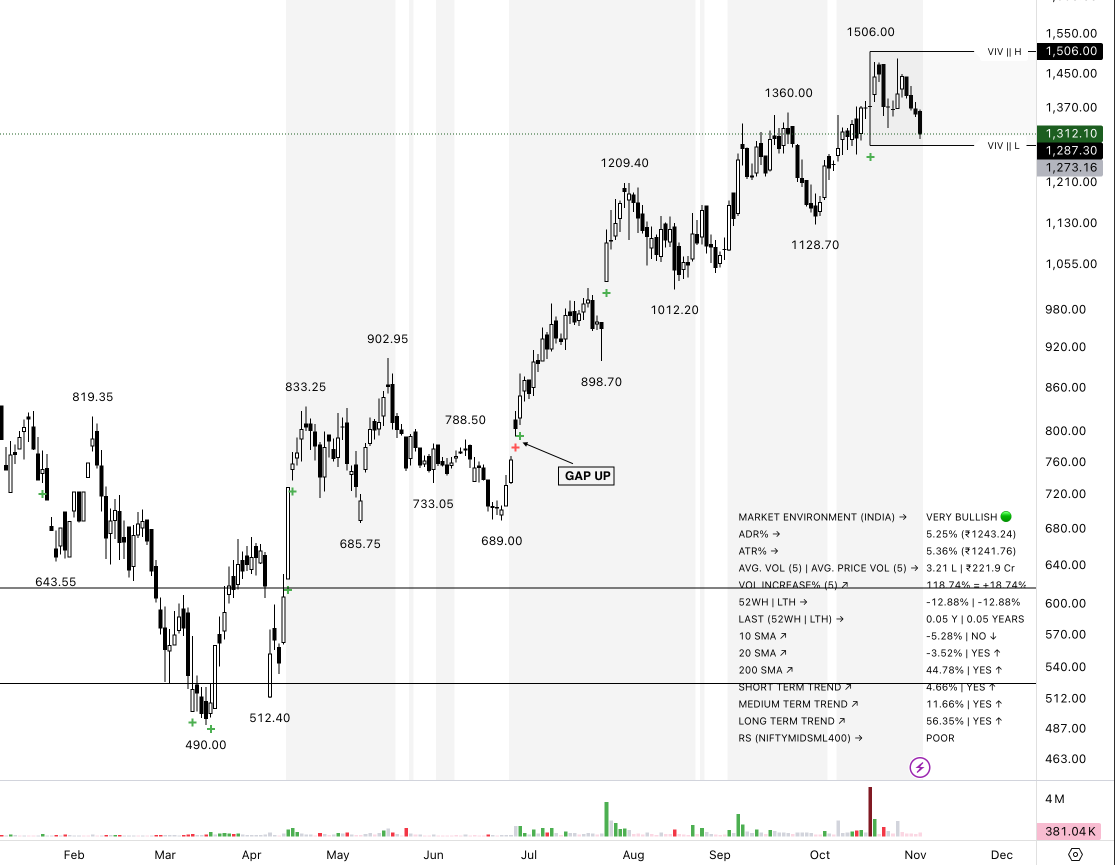
Volume gaps are the language of smart money. They tell stories of entry, exit, conviction, and exhaustion long before news or social media picks them up.
Most traders look for the “next big breakout.” Smart traders watch where big money quietly moved first. If you can read volume gaps, you’re not predicting the market — you’re aligning with the institutions who move it.
Don’t just read price — understand volume.

By Sunil Sethi
Trading markets since 2016 | Swing & Positional trader | Price Action | Reversals
Building clarity in the chaos of charts — blending tech leadership with market mastery.