There are no items in your cart
Add More
Add More
| Item Details | Price | ||
|---|---|---|---|

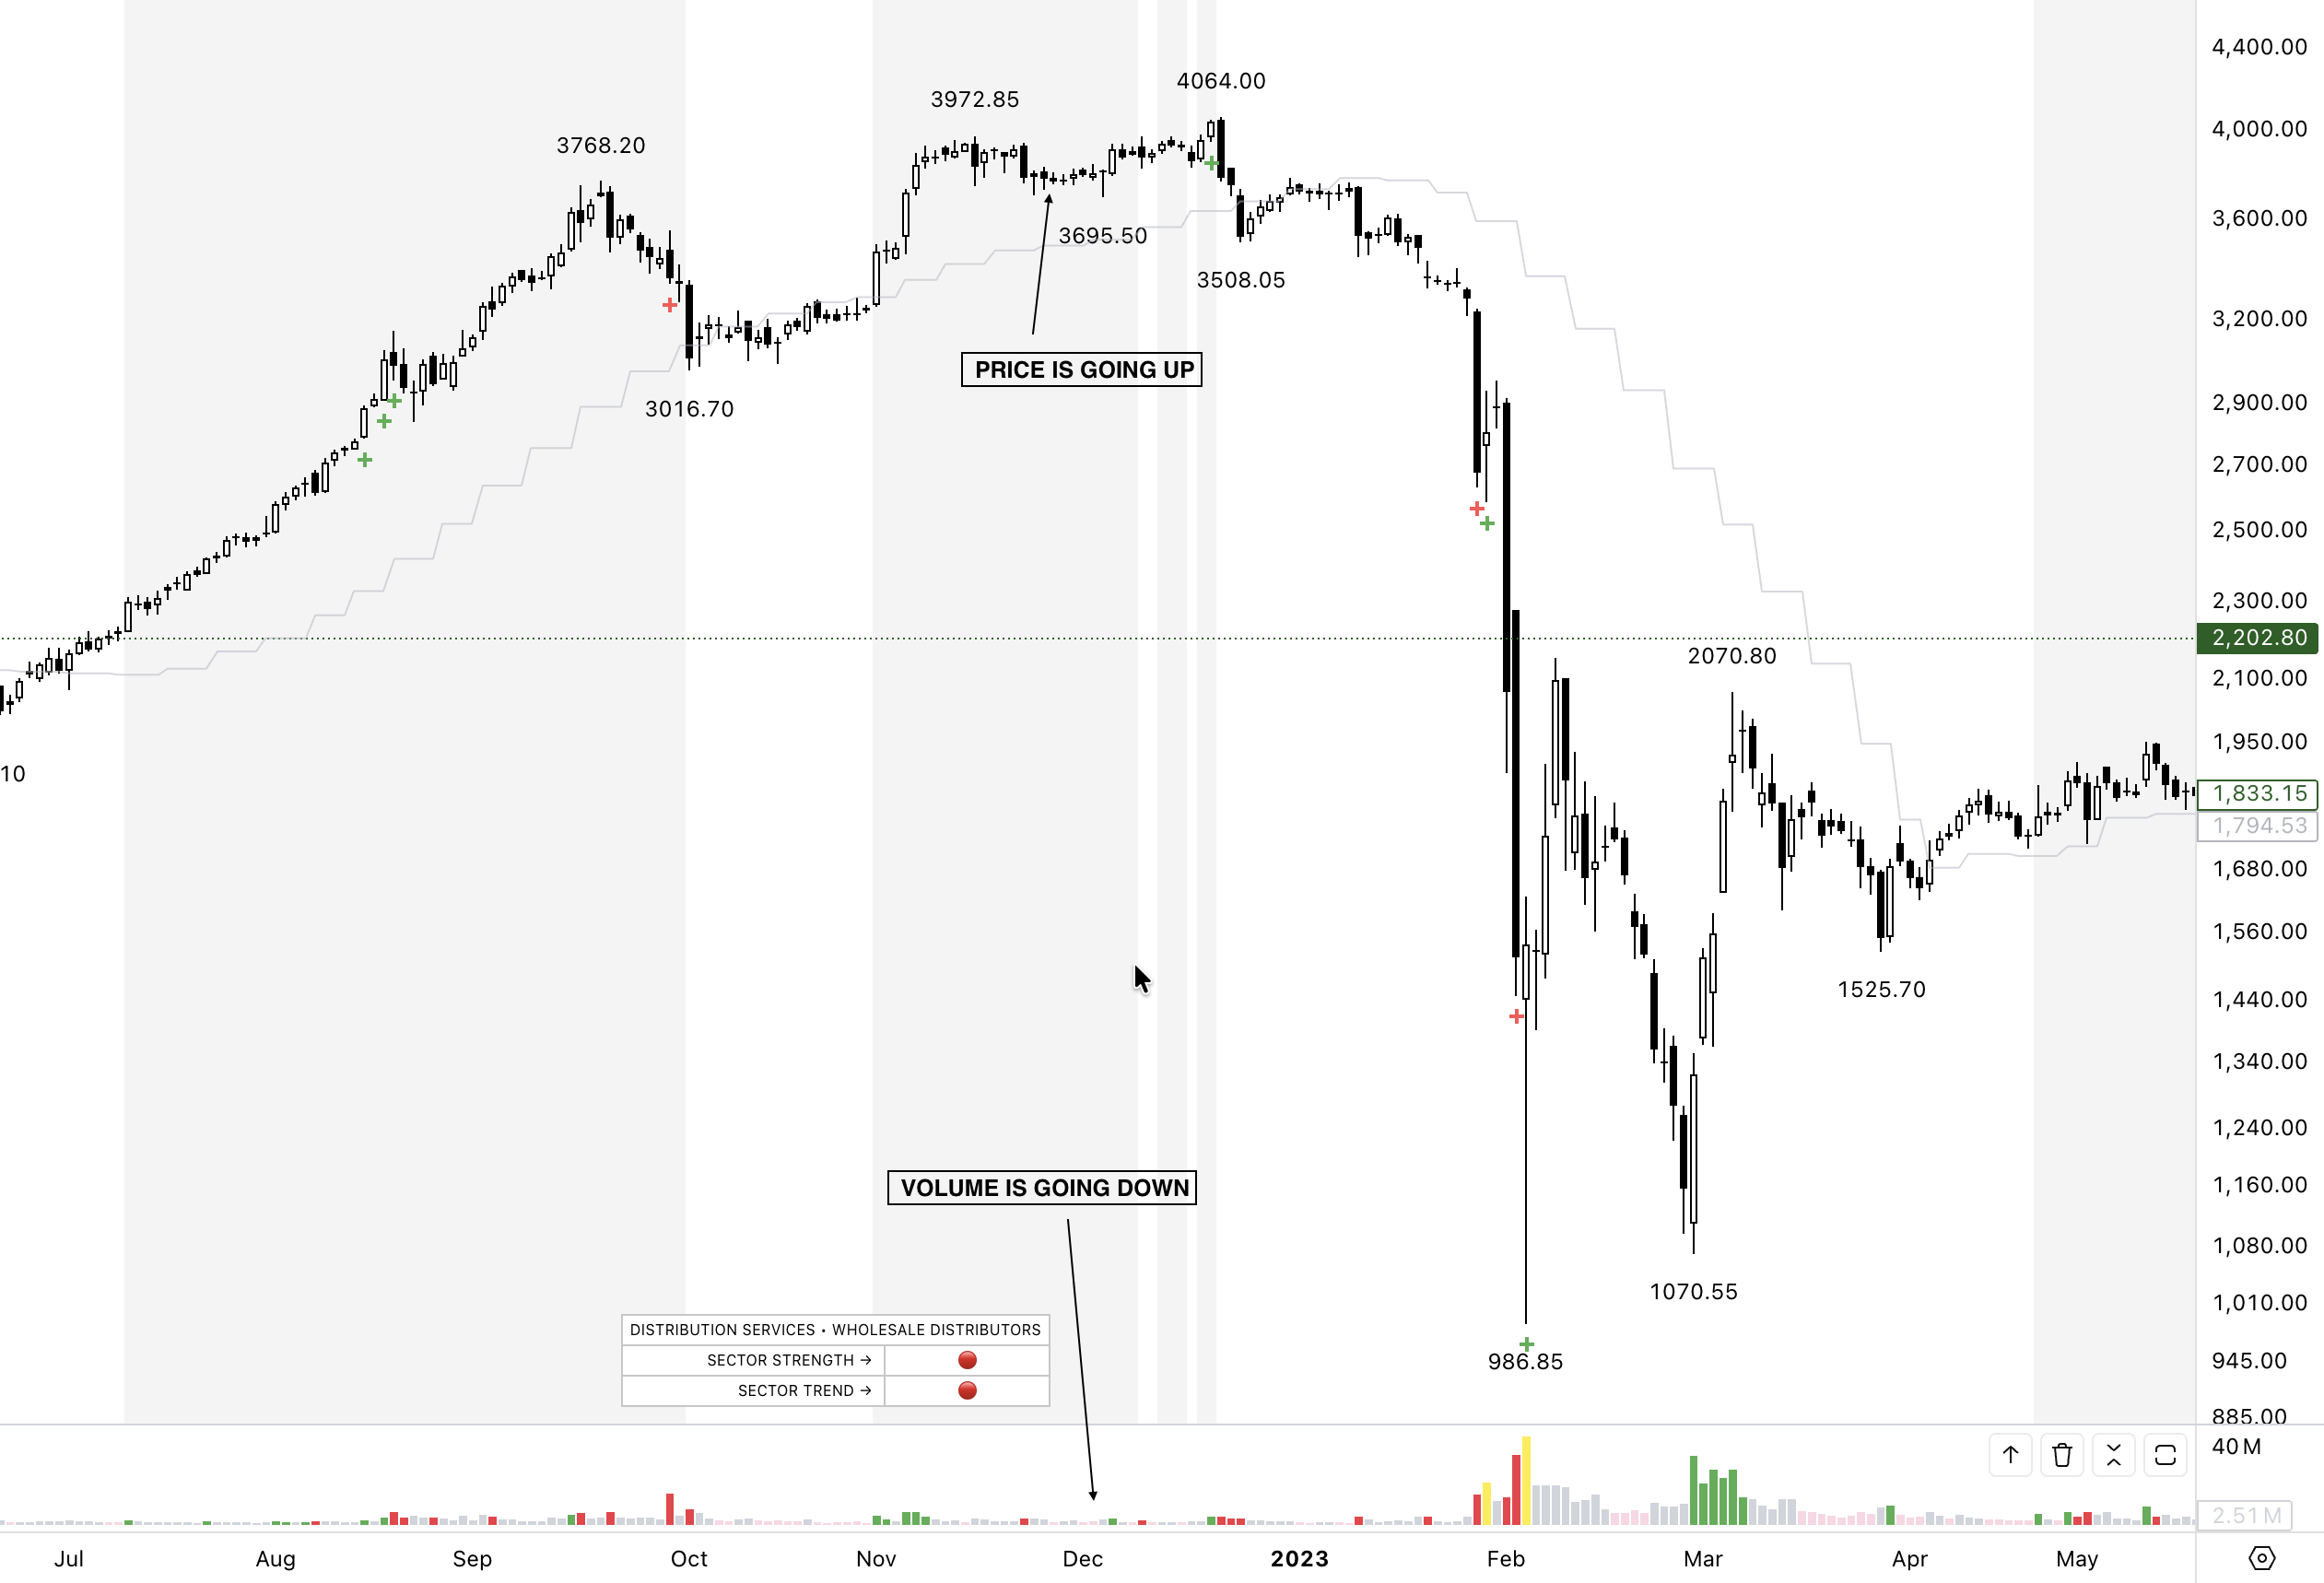
Price can lie. Volume rarely does. One of the most powerful yet misunderstood signals in trading is volume divergence — the moment when price continues in one direction but volume quietly disagrees.
Most traders focus only on the candles and assume that a rising price means strength or a falling price means weakness. But markets don’t move on price alone. They move on participation — and participation is revealed only through volume.
Volume divergence is the silent warning that a strong-looking trend may be hollow inside… and that smart money may be preparing for a reversal long before retail traders notice.
Volume divergence happens when price action and volume do not confirm each other.
Examples include:
Price is moving… but the fuel behind the move is drying up.This mismatch is a major footprint left by institutions — one that hints at exhaustion, distribution, or lack of conviction.
Price is reactive. Volume is revealing.
When big players accumulate or distribute, they don’t always push price aggressively. Instead, they adjust participation quietly.
Volume divergence is what exposes these silent shifts. It helps traders identify:
Bearish Volume Divergence
Most retail traders respond to what they see.
Institutions respond to what they anticipate. As price moves higher:
Institutions never exit all at once. They scale out quietly, often across multiple sessions, allowing retail demand to absorb their supply. Volume divergence is the trail they leave behind.
This is where VIV (Very Important Volume) gives traders a massive advantage. Most indicators try to predict reversals. VIV simply reveals the footprints that lead to reversals. 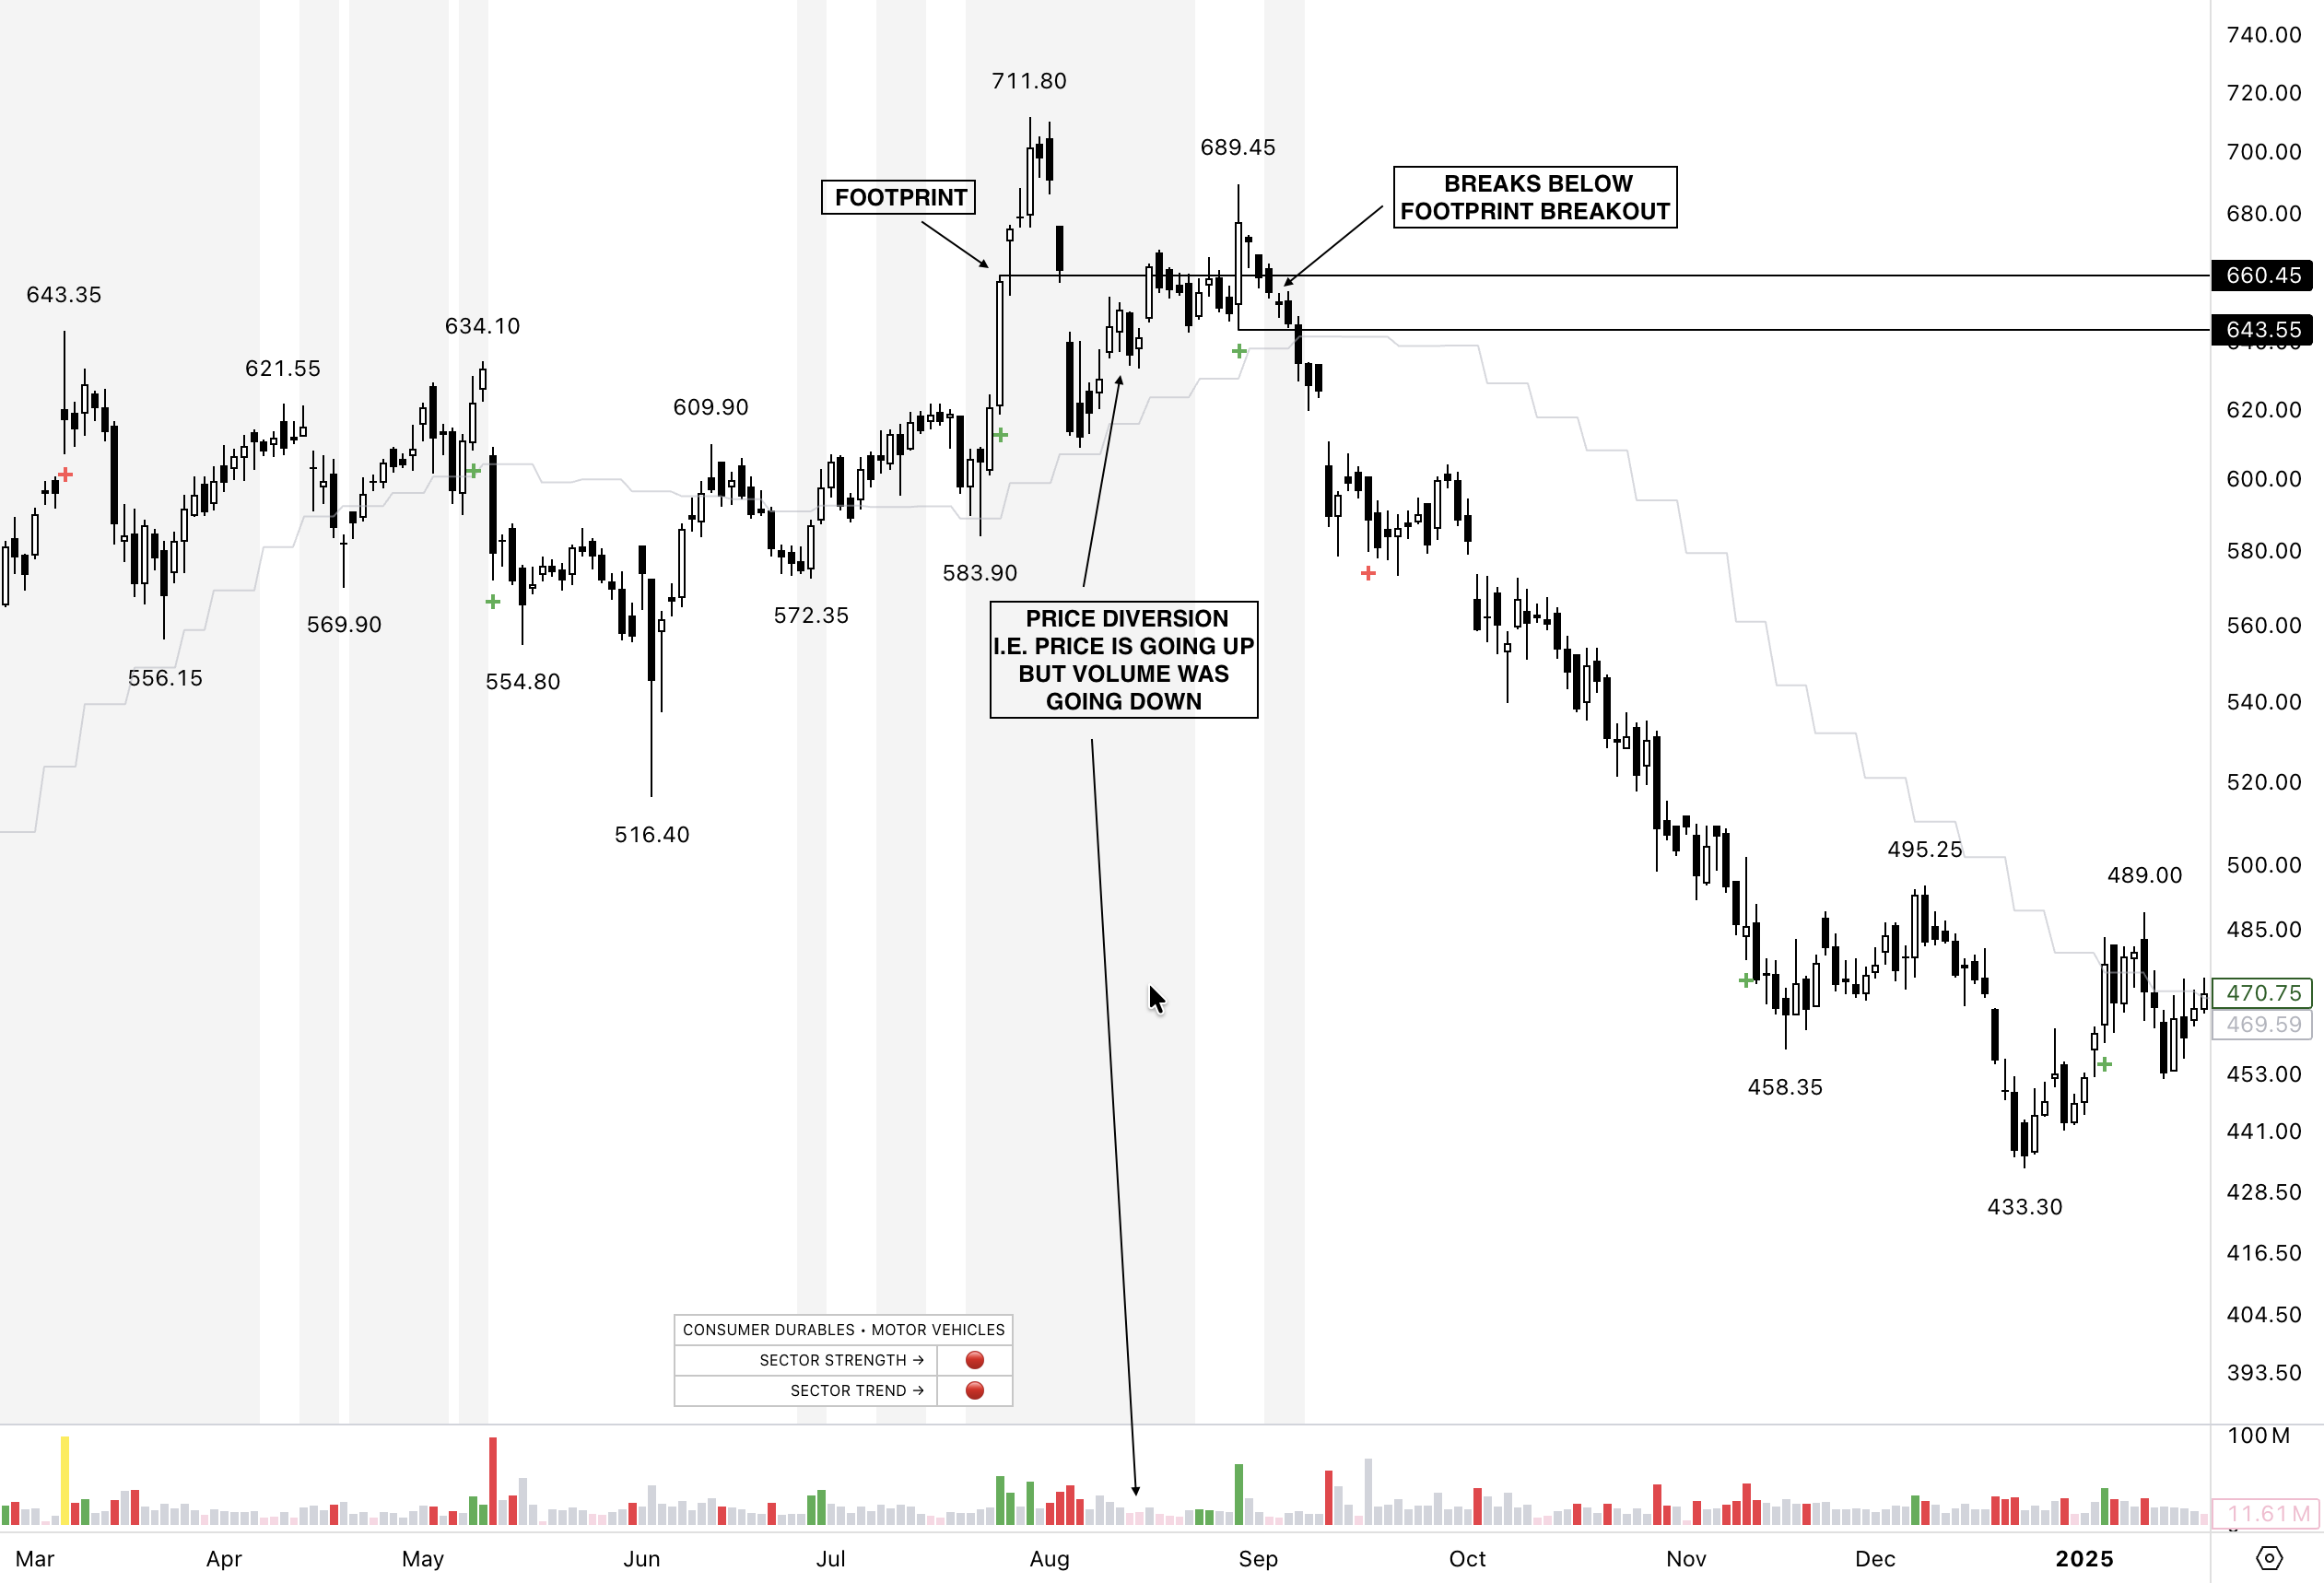
VIV helps you spot divergence by:
1. Highlighting High-Volume Footprints When footprint zones stop being defended, it signals distribution or exhaustion.
2. Showing When Price Revisits a Footprint Zone If volume is weaker on revisit → divergence
If demand fails to return → trend weakening
3. Identifying When Volume Should Expand but Doesn’t Breakouts without footprint-level volume are immediately obvious.
4. Exposing Fake Strength A rising price with declining footprint activity is a giant red flag. Price may trick you. Volume footprints never do.
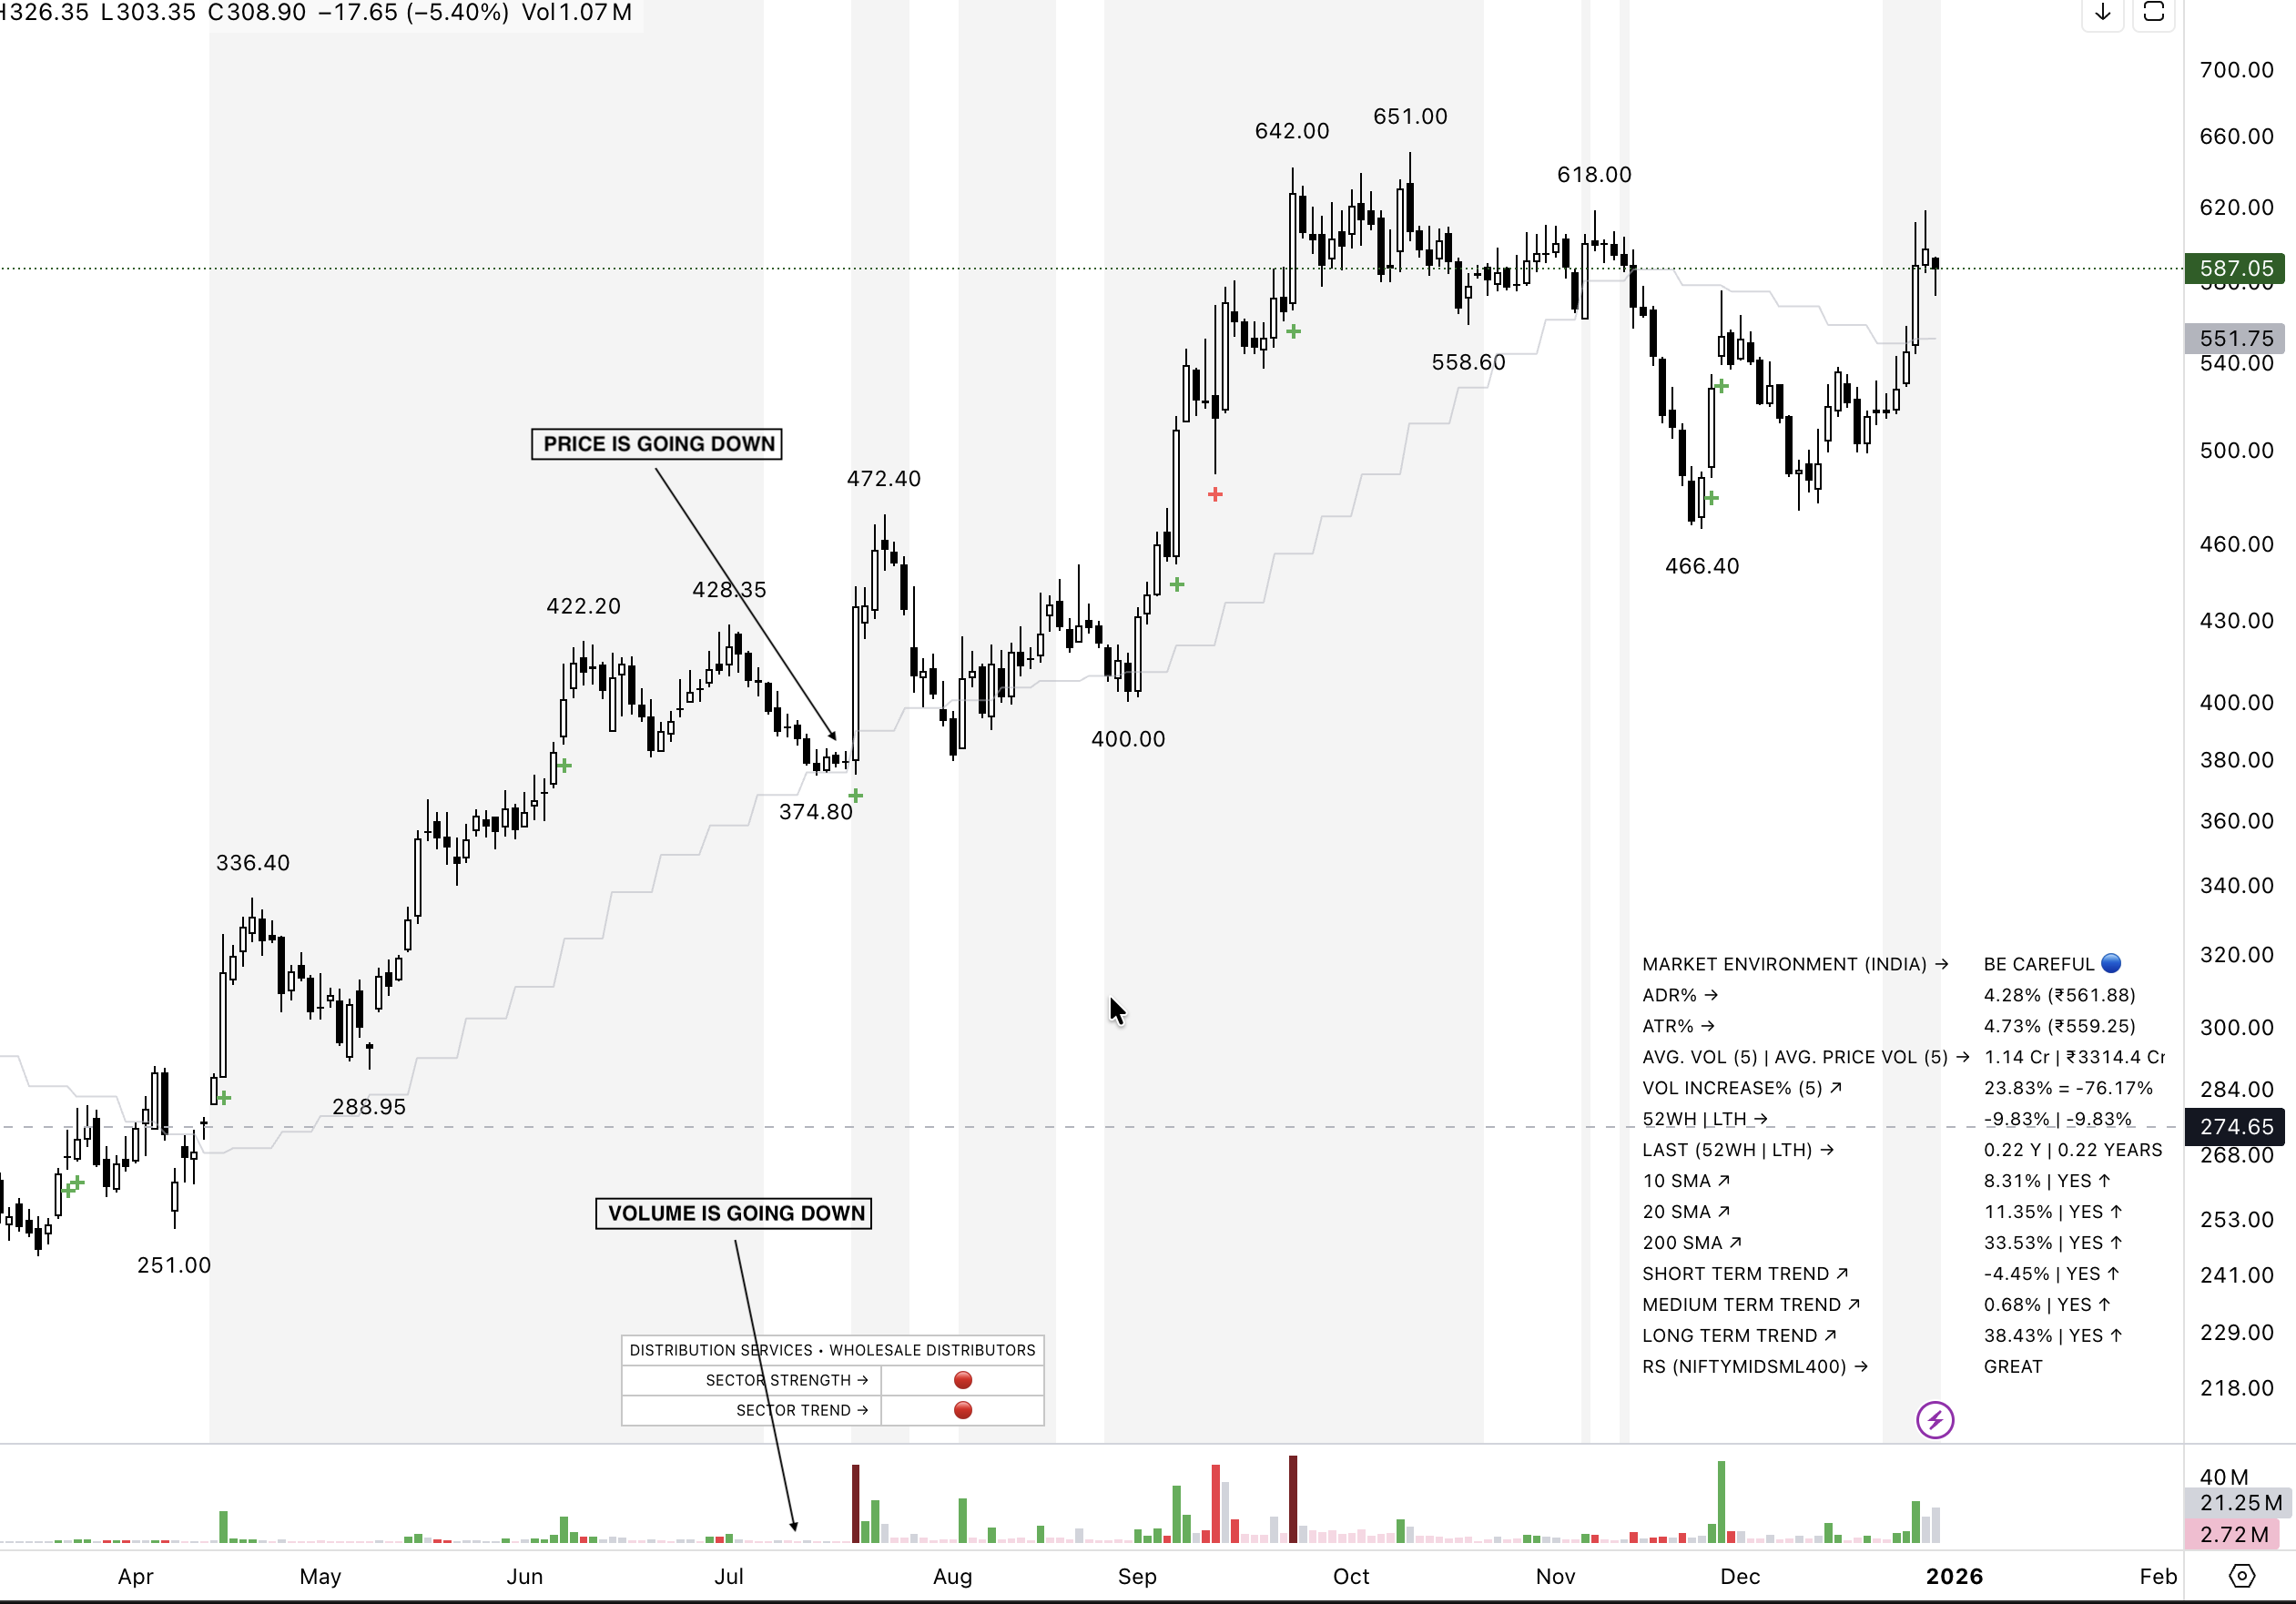
Imagine a stock rising from ₹300 to ₹350 with strong volume.
Then it rises from ₹350 to ₹360 but volume drops.
Then ₹360 to ₹365, volume drops again. Retail sees “new highs.”
Professionals see a dying trend. Days later, price collapses back to ₹340 — surprising retail traders.
But anyone observing VIV’s footprint zones would’ve seen the divergence clearly.
✔ Wait for confirmation - Divergence is an early warning — confirmation comes from structure.
✔ Adjust position size - Reduce risk when divergence appears.
✔ Move your stops - Protect profits when volume stops supporting the trend.
✔ Watch footprint zones closely - If institutions stop defending, a reversal is near.
Volume divergence is one of the most powerful signals in trading — not because it predicts the future, but because it reveals the truth behind price.
-Price can rise without conviction.
-Price can fall without strength.
But volume footprints — especially those highlighted by VIV — show where smart money is active, where they withdraw, and when the trend’s internal engine is losing fuel.
When volume and price disagree, always trust volume.
Trade with clarity. Trade with insight. Trade with VIV.

By Sunil Sethi
Trading markets since 2016 | Swing & Positional trader | Price Action | Reversals
Building clarity in the chaos of charts — blending tech leadership with market mastery.