There are no items in your cart
Add More
Add More
| Item Details | Price | ||
|---|---|---|---|

Every major market move — every breakout, every rally, every reversal — starts from a quiet place.
Not from the news. Not from social media. But from hidden zones on the chart where smart money positions itself long before the trend begins.
These areas are called volume clusters — regions where significant trading activity occurs without much price movement. While most traders see a flat, sideways market, institutions are quietly building positions. When the accumulation is complete, price explodes — leaving retail traders wondering “How did I miss that?”
The good news? You can spot these zones — and the VIV Indicator makes it effortless.
A volume cluster is a region on the chart where a large amount of trading volume occurs within a relatively narrow price range.
It represents a balance zone — a tug of war between buyers and sellers where big institutions accumulate or distribute shares.
When the balance finally breaks, the next directional move is often strong and sustained, because the groundwork (accumulation or distribution) was already done.
Think of volume clusters as the roots of a tree. You may not see what’s happening underground, but the strength of the tree depends on it.
Markets are not random — they are built on human behavior and institutional planning. When price stays in a range for days or weeks with heavy volume, it’s not indecision — it’s preparation.
Smart money accumulates quietly, absorbing shares from impatient traders who think “nothing is happening.” When enough inventory is collected, the breakout begins — and by the time retail traders notice, the move is already halfway done.
Understanding this cycle is destiny for a trader — it shifts your focus from chasing breakouts to spotting where they’re born.
If you were to spot them without tools, you’d look for:
The VIV Indicator (Very Important Volume) analyzes price and volume together to identify zones where institutional participation is concentrated. Here’s how it helps: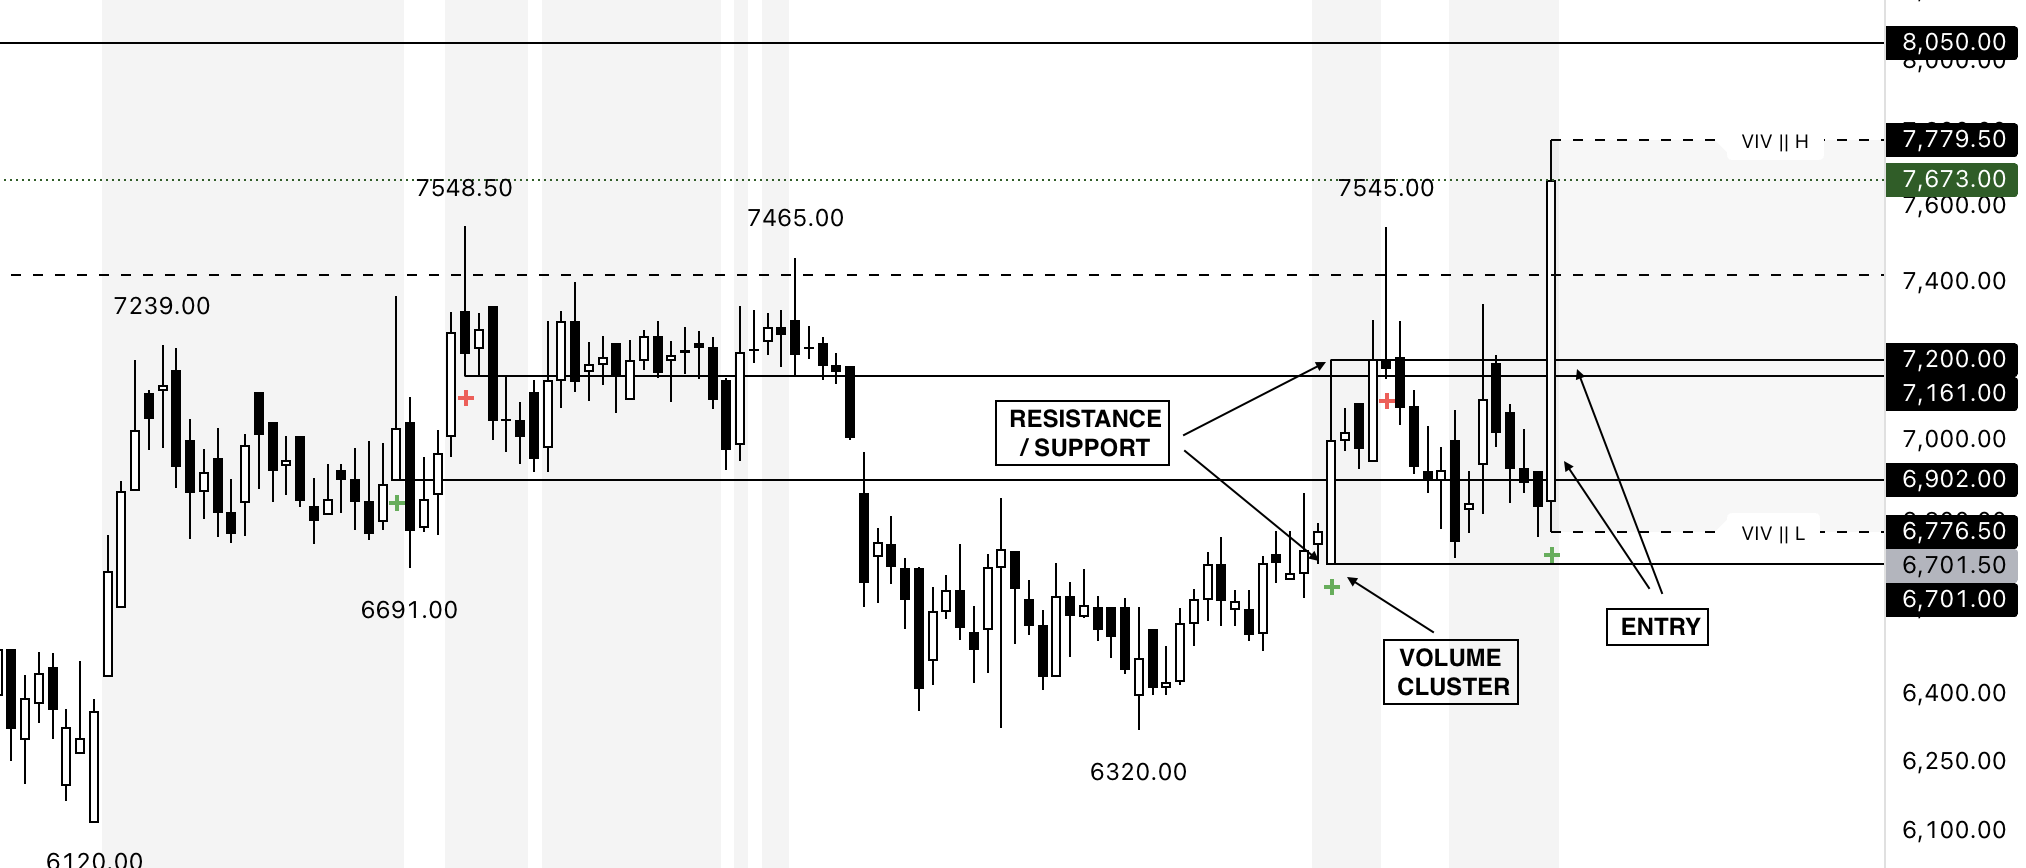
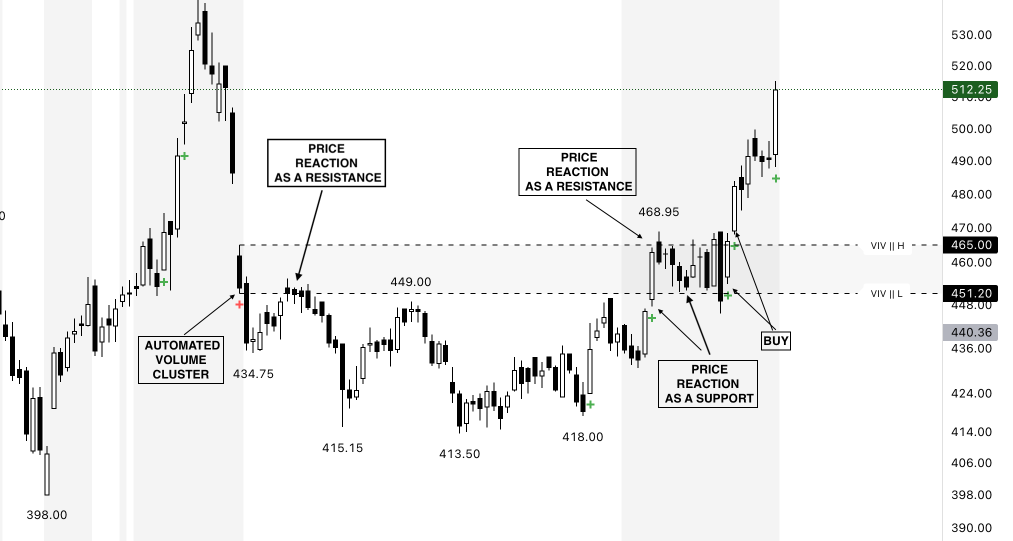 In essence, VIV translates the hidden story of accumulation and distribution into clear, actionable visuals.
Here’s how professional traders use these zones:
Institutions never announce their entries — they create liquidity pockets through repeated buying and selling within tight ranges. Once their position is built, they unleash the trend — and those who can read the cluster footprints are prepared.
Retail traders often see “boring sideways markets.”
Professionals see the birthplace of the next big move.VIV helps traders see what institutions don’t want them to notice — the quiet accumulation before the storm.
Trading isn’t about predicting news or guessing market direction — it’s about reading footprints. Volume clusters are those footprints — hidden zones that reveal the silent work of smart money before trends ignite.
By highlighting these zones automatically, VIV gives traders clarity, context, and confidence. It turns invisible market preparation into visible opportunity.
When you learn to see where energy builds, you don’t chase the market anymore — you simply wait for the story to unfold from the roots up.

By Sunil Sethi
Trading markets since 2016 | Swing & Positional trader | Price Action | Reversals
Building clarity in the chaos of charts — blending tech leadership with market mastery.