Multi-Timeframe Price Action: How to Read the Market’s Full Story

Every chart tells a story — but never the complete story.
What looks like a breakout on the daily chart might be a simple pullback on the weekly. What appears as weakness on the hourly may be nothing more than noise inside a strong uptrend.

Traders who analyze only a single timeframe often trade blindfolded.
But traders who understand multi-timeframe storytelling see the full narrative — the long-term trend, the medium-term structure, and the short-term execution window.

Mastering this concept is not about complexity. It’s about clarity. It shifts you from reacting to candles to understanding context.

Why Multi-Timeframe Reading Is Essential

The market operates across different time horizons because participants operate across different time horizons:

  • Investors influence the monthly and weekly charts
  • Swing traders shape the daily timeframe
  • Intraday traders affect the lower timeframes
When you learn to read multiple timeframes, you align yourself with the dominant forces — not the noise. Multi-timeframe analysis gives you:
  • The true direction of the trend
  • The strength of the move
  • The context of pullbacks
  • The intent of price formations
  • The timing for entries
It turns confusion into clarity.

The Three-Layer Storytelling Method

1. Higher Timeframe (HTF): The Storyline This is where the real truth lies.
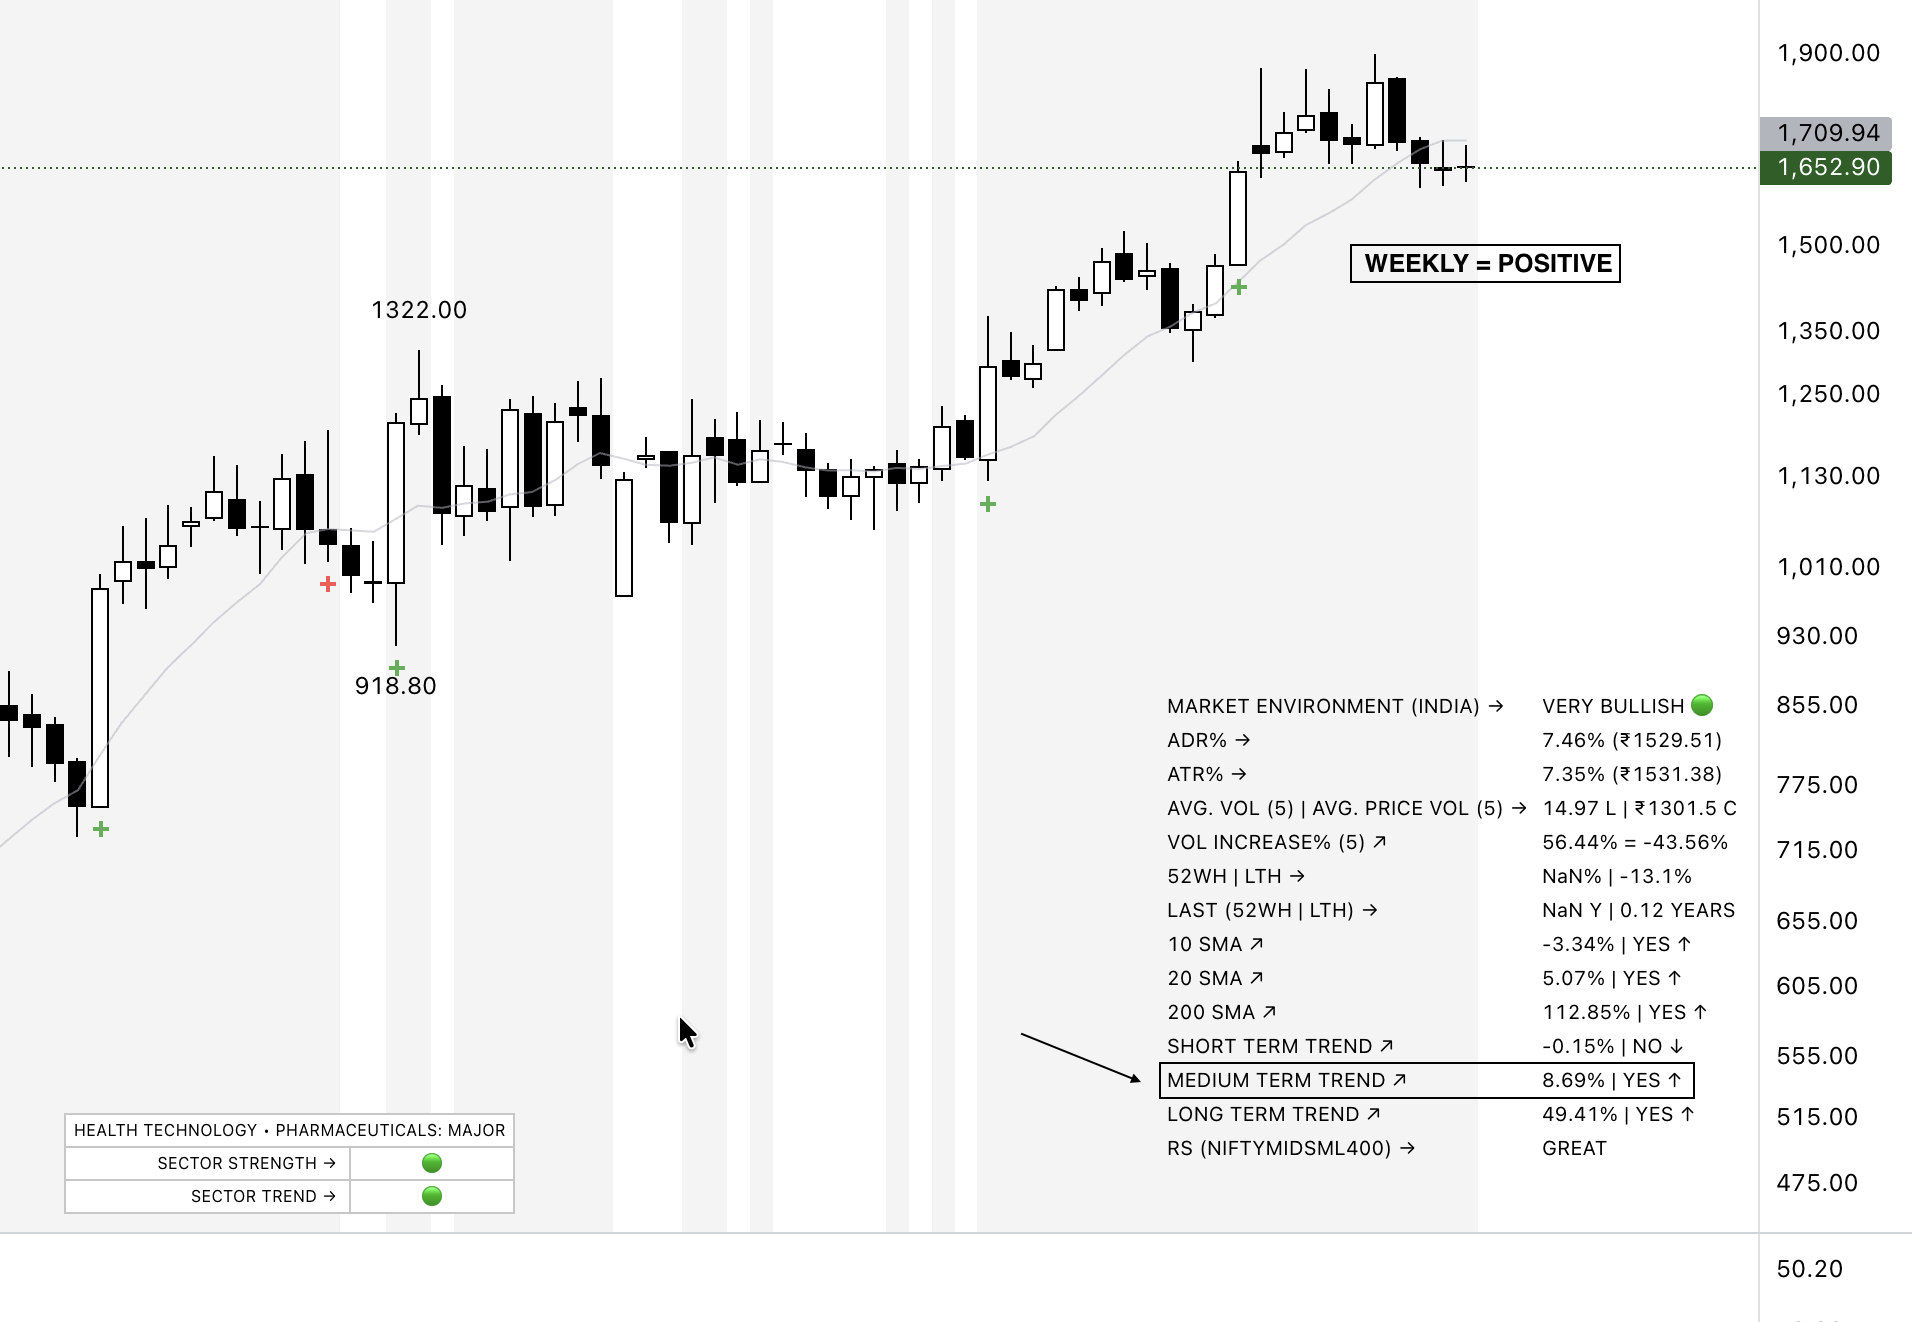
The weekly or monthly chart shows the overall direction, institutional positioning, and the big-picture structure. Here you identify:

  • Trend direction
  • Major support and resistance
  • Key swing points
  • Long-term footprint zones
  • Market health
HTF gives you a sense of destiny — where the market wants to go.
2. Middle Timeframe (MTF): The Chapter The daily chart acts as the bridge between the large trend and your execution.

This is where you recognize:
  • Consolidations
  • Continuation patterns
  • Breakout zones
  • Pullback quality
MTF helps you understand where you are within the larger trend.
3. Lower Timeframe (LTF): The Sentence The lower timeframe (hourly, 30-min, or even 15-min) gives you precise entries.

This is where you see:
  • Triggers
  • Compression
  • Springs
  • Retests
  • Micro pullbacks
LTF helps you execute setups with low risk and clean timing.

How a Multi-Timeframe Conflict Creates False Signals

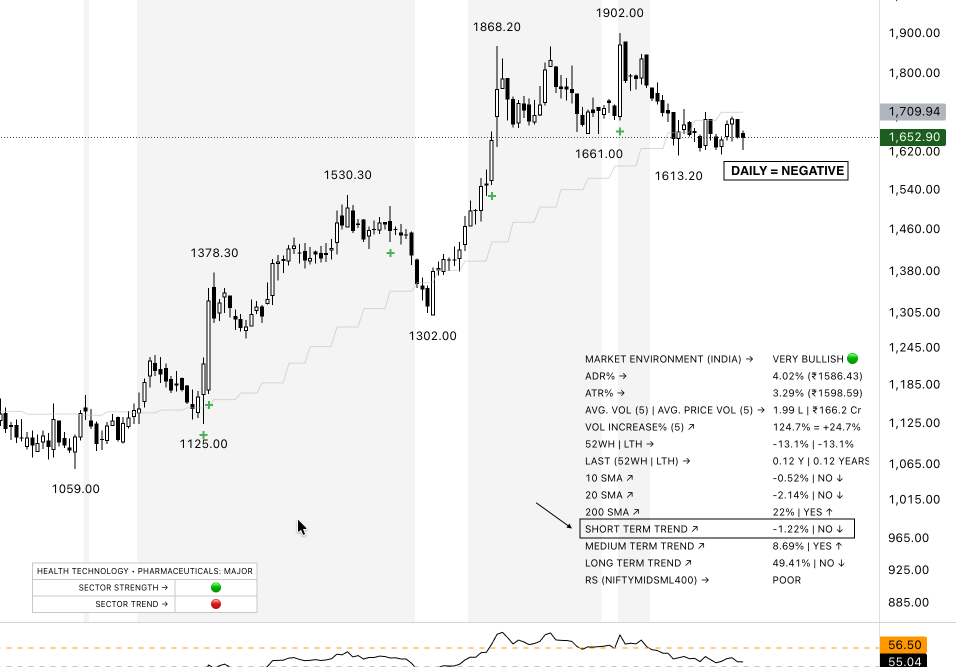
Many false breakouts happen because traders only look at one timeframe.
Here’s how conflict deceives traders:

  • A daily breakout may fail because the weekly is hitting resistance.
  • A daily pullback may look bearish while the weekly is showing strong absorption.
  • An intraday breakdown may reverse immediately because the daily trend is strong.
When timeframes disagree, the probability of your trade decreases dramatically.

How Multi-Timeframe Alignment Creates High-Probability Setups

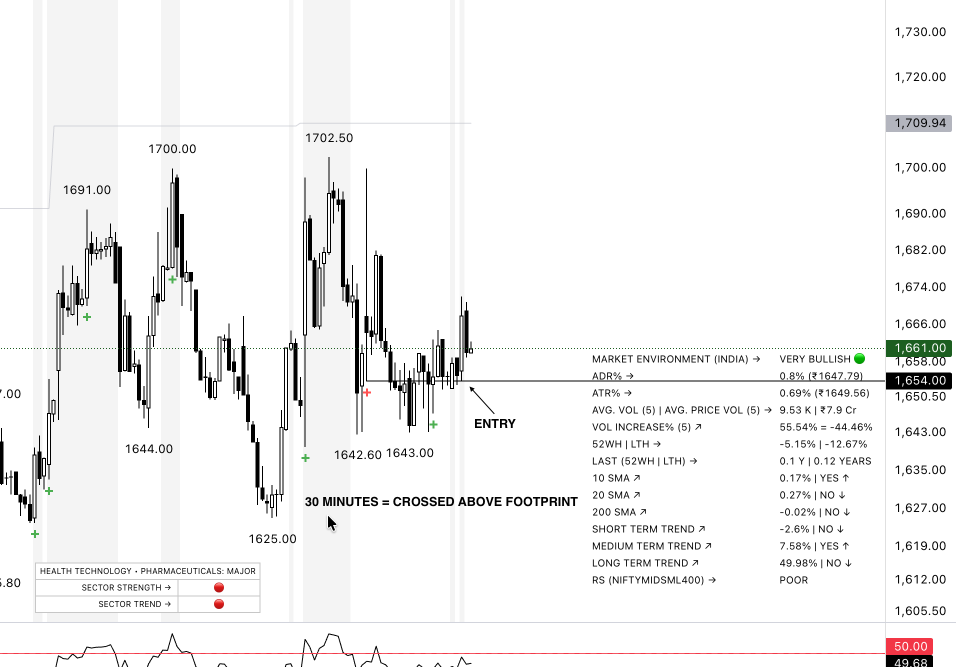
The best trades come when:

  • HTF trend = bullish
  • MTF structure = bullish consolidation
  • LTF = clean breakout or retest entry
Alignment creates:
  • Direction
  • Momentum
  • Confidence
  • Clarity
It’s like having all traffic lights turn green at the same time.
That’s when you step on the accelerator.

Practical Multi-Timeframe Workflow

Here’s a simple, repeatable routine:
Step 1: Start With HTF (Weekly) Ask:

  • Is the trend up, down, or sideways?
  • Are we near major levels?
  • Is price expanding or compressing?
Step 2: Move to MTF (Daily) Ask:
  • Are we forming higher highs/lows?
  • Are we consolidating or trending?
  • Is there compression forming before expansion?
Step 3: Finish on LTF Ask:
  • Where is the optimal risk entry?
  • Are there clean retests or tight flags?
  • Is the micro-structure aligned with the macro?

The Psychology Behind Multi-Timeframe Reading

Most traders rush into setups because they look “ready.”
But professionals know that setups are only as strong as the timeframe supporting them. Multi-timeframe reading builds:

  • Patience
  • Discipline
  • Awareness
  • Timing
  • Confidence
It prevents emotional entries and forces you to think like institutions — with context, not impulse.

Common Mistakes Traders Make

  • Starting from the wrong timeframe
    Beginning with the lower timeframes creates noise-driven decisions.
  • Ignoring the higher timeframe trend
    Fighting weekly direction is like swimming against a current.
  • Trading micro patterns without macro support
    A perfect flag in a weak weekly chart is not a high-quality setup.
  • Overloading with too many timeframes
    Stick to 3. More creates paralysis.

Conclusion

Price action is a language — and multi-timeframe analysis is how you understand the full sentence, not just a word. When you learn to read trends across timeframes, the market becomes coherent. Pullbacks make sense, breakouts become predictable, and traps reveal themselves before they form.

Remember:
The market speaks differently on each timeframe.
Your edge comes from understanding the entire story, not a single chapter.

Trade with context. Trade with clarity. Trade with the full picture.

X

By Sunil Sethi
Trading markets since 2016 | Swing & Positional trader | Price Action | Reversals
Building clarity in the chaos of charts — blending tech leadership with market mastery.

VIP - VERY IMPORTANT PERSON
VIV - VERY
IMPORTANT VOLUME
⇢ BE A VIP WITH VIV

Learn. Apply. Trade Smarter with VIV →