How to Spot Institutional Accumulation (VIV Highlights It Automatically)

Why You Keep Buying Late 

Ever wonder why price often takes off after you’ve given up on it? That’s because institutions quietly accumulate positions before the big move — while retail traders sit on the sidelines or get shaken out. These phases aren’t random. They’re deliberate, methodical, and visible to anyone who knows what to look for in price and volume. The good news: once you understand how to read accumulation footprints, you’ll stop chasing rallies and start entering before the crowd.

1. What Is Institutional Accumulation?

Accumulation is when large players — hedge funds, banks, prop desks — build positions without driving the market sharply higher. Their goal is to buy size quietly before launching a trend. Key characteristics:

  • Sideways or tight price ranges after a prior decline.
  • Sudden bursts of volume on up-moves, but price doesn’t collapse afterward.
  • Support levels holding repeatedly, showing someone is absorbing selling pressure.

2. The Problem With Finding It Manually

Retail traders try to identify accumulation using patterns: flags, rectangles, Wyckoff phases. But these can be misleading.

  • Not every sideways range is accumulation — sometimes it’s just indecision.
  • Volume spikes aren’t always bullish — they could be distribution (selling) instead of buying.
  • It takes experience to distinguish real institutional activity from random noise.
If you’re drawing boxes and guessing which ones are “smart money,” you’ll be wrong as often as you’re right.

3. Clues of Real Accumulation (If You Read It Manually)

Even without tools, you can spot accumulation using these filters:

  1. Price stops making lower lows.
    • Even after bearish news, the market refuses to break down.
  2. Volume is rising on upward pushes, but not on pullbacks.
    • Buying shows strength, selling looks weak.
  3. Long lower wicks on candles in the range.
    • Aggressive buying absorbs every dip.
  4. Breakouts from the range come on heavy volume.
    • Proof that institutions are finally done building their positions and are pushing price higher.

How VIV Makes It Automatic

Instead of manually scanning every chart and second-guessing volume, VIV (Very Important Volume) highlights these footprints for you.

  • VIV automatically flags candles with exceptional participation e.g. VIV || H, VIV || L or + signs.
    These are likely moments when big players were active — the very clues you need.
  • It shows you where accumulation is happening, not just when.
    By marking the high-volume zones, you instantly see which price levels institutions care about.
  • No chart clutter.
    Instead of drawing endless rectangles and arrows, VIV keeps your chart clean while still pointing out the “smart money footprints e.g. VIV || H, VIV || L or + signs”.
In short: VIV does the heavy lifting so you don’t have to guess.

Turning Knowledge Into Trades

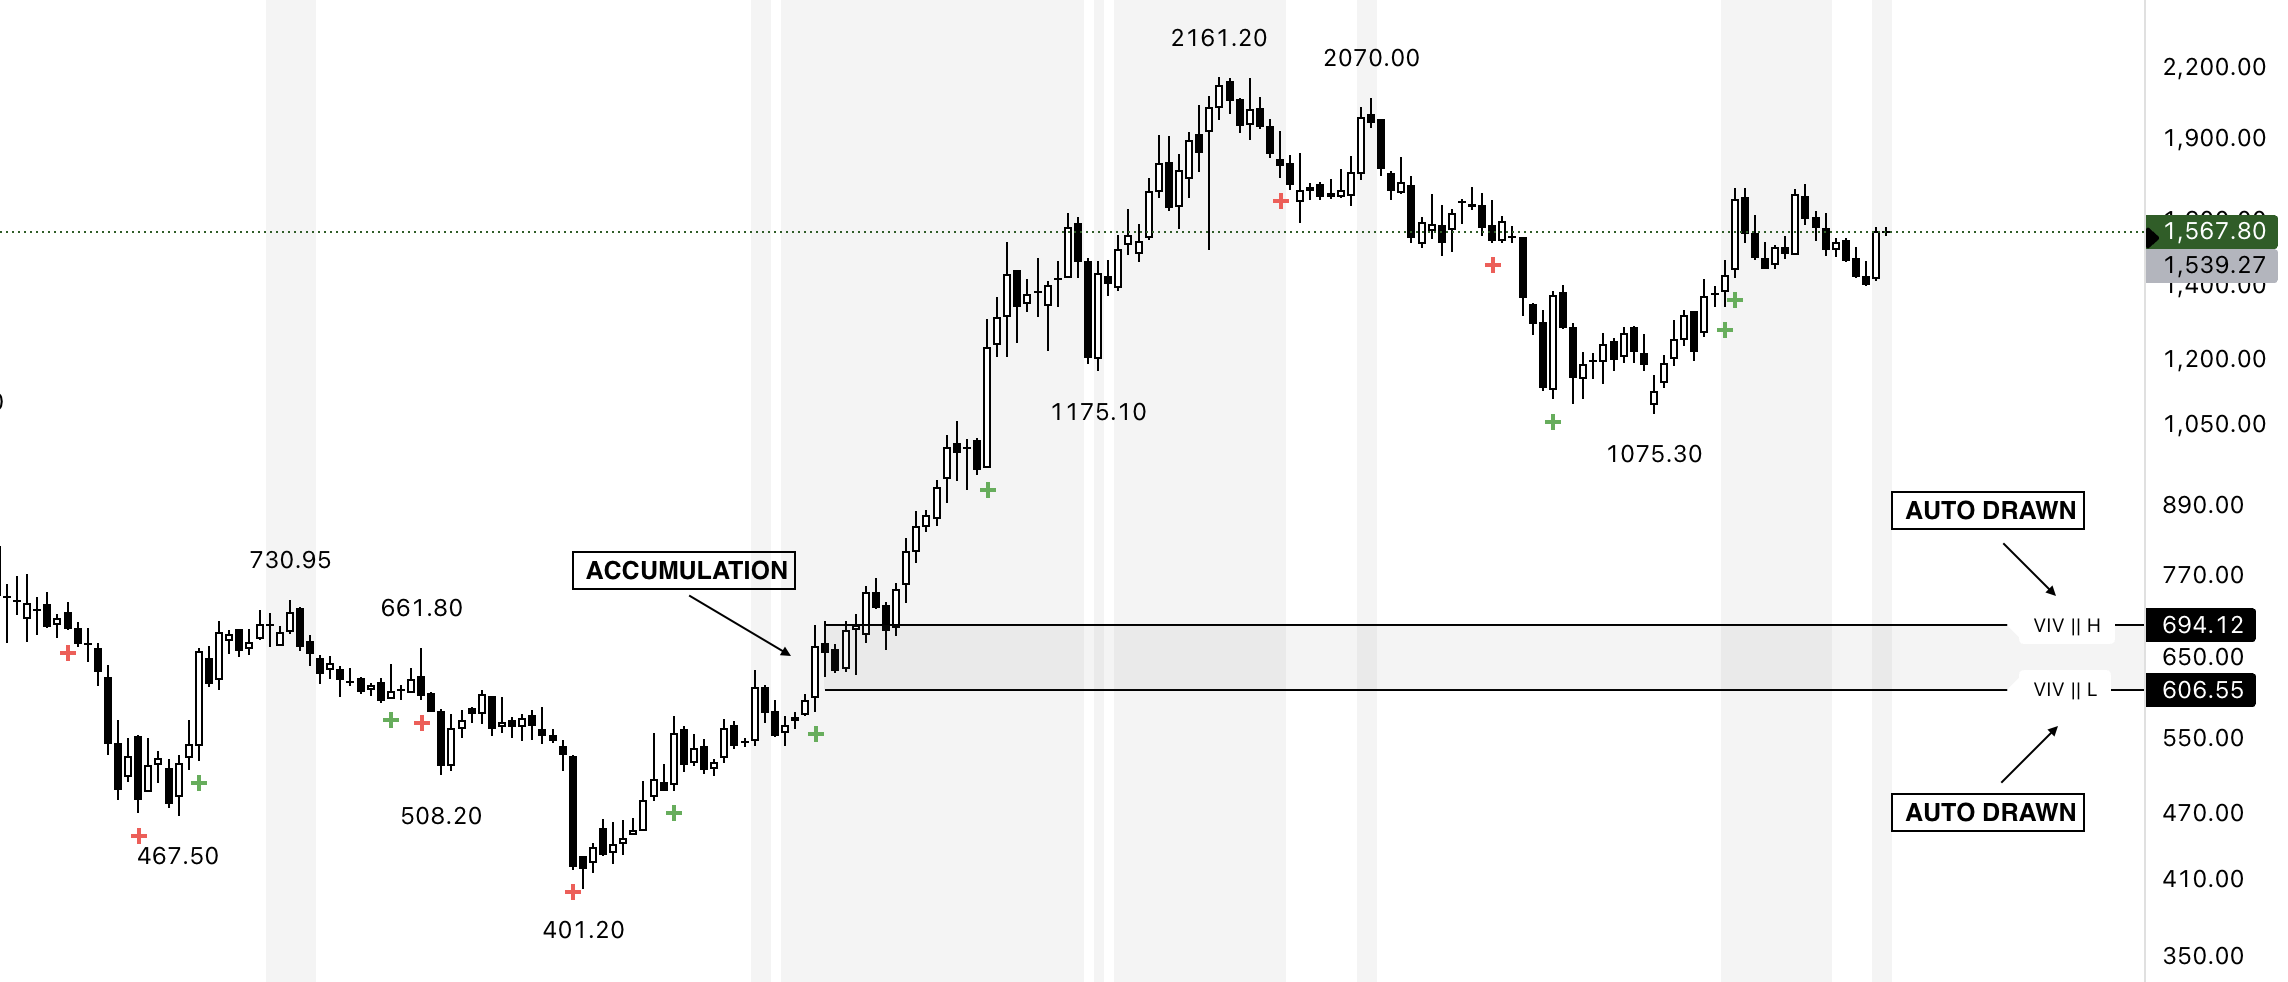
Once you can see accumulation clearly — manually or using VIV — trading becomes simpler:

  1. Enter near the bottom of the range, not after the breakout.
  2. Use the high-volume candles as your “line in the sand.” If price stays above them, accumulation is intact.
  3. Add size when price breaks out with strong volume. That’s confirmation the institutions are done building and ready to push price.
This way you’re buying with the big players instead of chasing after them.

Conclusion

  • Accumulation is where big money quietly loads up.
  • It leaves clear footprints in price and volume.
  • Manual spotting works, but takes time and skill.
  • VIV makes it automatic by highlighting very important volume candles and zones.
If you’ve been late to every rally, it’s not because you’re unlucky — it’s because you’re not seeing what the smart money is doing in advance. Once you learn to recognize accumulation (or let VIV shows you), you’ll start entering before the crowd, not after them.

X

By Sunil Sethi
Trading markets since 2016 | Swing & Positional trader | Price Action | Reversals
Building clarity in the chaos of charts — blending tech leadership with market mastery.

VIP - VERY IMPORTANT PERSON
VIV - VERY
IMPORTANT VOLUME
⇢ BE A VIP WITH VIV

Spot Footprints (+) With VIV →