There are no items in your cart
Add More
Add More
| Item Details | Price | ||
|---|---|---|---|

Every trader remembers that one chart — the one that looked perfect. The breakout was clean, the volume spike convincing, and yet the trade failed miserably. You check everything again, wondering what you missed. The truth is simple but often ignored: you didn’t see what really moved the market. Price shows what happened; volume reveals who made it happen.
But not all volume is visible — much of it hides quietly in the background, where institutions quietly build or unwind positions. That’s where the real edge lies: in spotting these hidden volume footprints before everyone else.
Ask any trader why they entered a trade, and you’ll often hear:
“It broke out,” or “The setup looked good.”
But if you dig deeper, most can’t answer who was buying or selling. They react to price, not to intention.
And that’s where most traders get trapped — following the surface instead of understanding the footprints beneath it.
Every candle hides a story. Some are retail noise, some are emotion, and a few are institutional footprints — those quiet, powerful actions that set the stage for tomorrow’s headlines.
Volume is supposed to tell the truth — but most traders read it wrong.
They rely on indicators that smooth data, showing volume averages but not where the real battle took place. Here’s the uncomfortable truth: Institutions don’t chase price. They build positions — slowly, quietly, across multiple sessions. During that phase, you’ll often see:
Smart money doesn’t move in the open.
They know that if retail traders spot their accumulation or distribution too early, they’ll spoil the party.
That’s why they operate in volume silence — smaller bursts spread across sessions, balanced candles, controlled volatility. But when you zoom out, these small but powerful moments form clusters — zones that determine the next big move.
If you learn to spot these zones, you’ll no longer ask “Why did price bounce here?”
You’ll already know the answer.
Most charting platforms only show visible volume bars — they don’t tell you which one matters. Traders see dozens of green and red bars every day but can’t distinguish between:
This is exactly why we built VIV (Very Important Volume) — to help traders see what’s been invisible for too long. VIV doesn’t rely on arbitrary averages or outdated volume filters. Instead, it: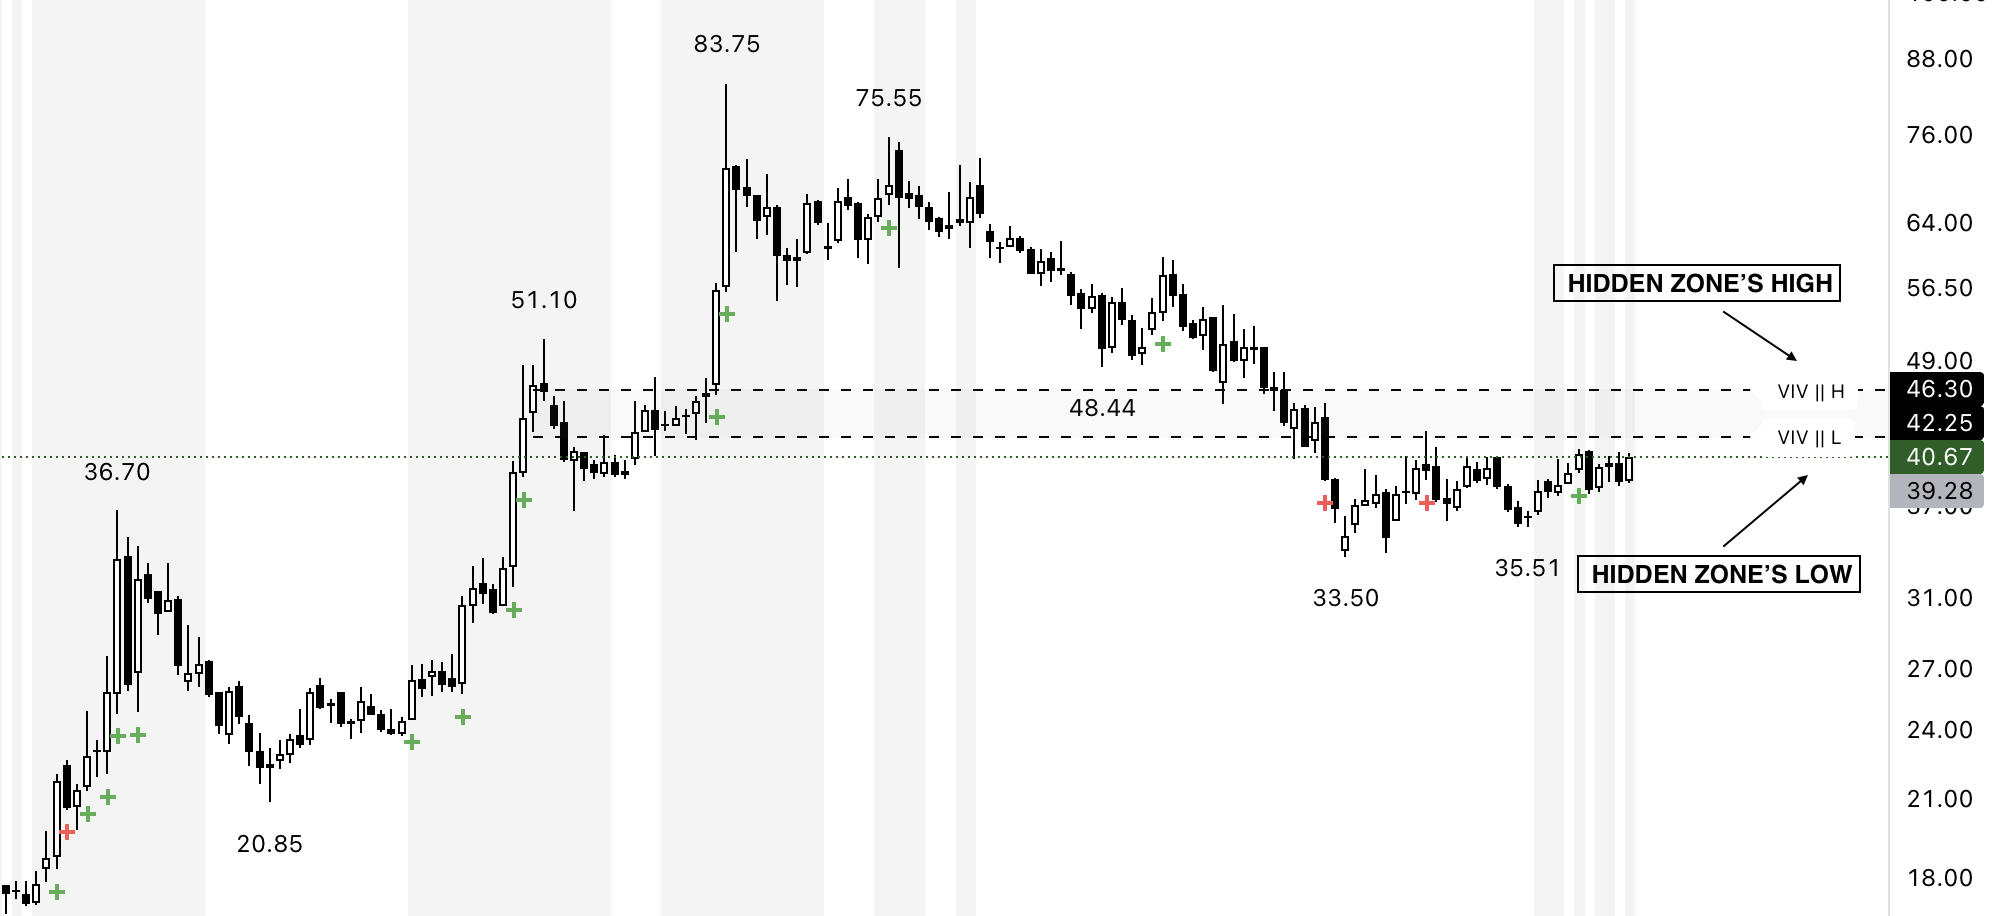
Let’s take a real-world scenario. You see a stock breakout above resistance with strong volume. Everyone celebrates. But within days, it fails — stops are hit, confidence drops, and social media calls it a “fake breakout.”
What happened?
The truth lies in volume footprints.
If you had VIV, you would have seen that the breakout candle occurred far from any institutional footprint zone — meaning no smart money was defending it. The breakout was retail-driven, hence short-lived.
But when breakouts occur from a defended footprint, they sustain, retest cleanly, and grow steadily.
That’s not magic — that’s institutional participation.
What makes VIV different is not that it adds another “indicator” — it adds perspective.
90% of traders rely on hope — that their setup works, that the market turns, that a stop-loss won’t hit.
Only 10% rely on logic — evidence, footprints, and real-time intent.
VIV bridges that gap.
It turns your analysis from reactive to proactive — so you’re no longer chasing signals; you’re aligning with the invisible forces that drive them.
Hidden volume footprints are the invisible DNA of every strong move.
They reveal where the smart money entered, where it defended, and where it gave up. Most traders never see them — not because they aren’t there, but because they aren’t looking the right way.
With VIV, you no longer have to guess.
You can see the footprints, understand their significance, and act when it truly matters.
Trade with clarity, not hope — trade with VIV.

By Sunil Sethi
Trading markets since 2016 | Swing & Positional trader | Price Action | Reversals
Building clarity in the chaos of charts — blending tech leadership with market mastery.