Footprint Retests: How VIV Confirms Whether Big Money Is Still in the Game

Every trader wants confidence — confidence that a breakout will hold, that a trend will continue, and that a level is worth trusting.
But confidence doesn’t come from indicators or opinions. It comes from clarity — and the clearest evidence in the market is whether institutions defend their critical volume zones during retests.

This is the essence of footprint retests.
Footprint retests tell you something no candle pattern can reveal:

Whether smart money is still in the game — or if they’ve quietly stepped aside.
Most traders never see these retests because volume footprints are invisible on traditional charts. But with VIV, these footprints become visible… and retests become opportunities, not mysteries.

What Are Footprint Retests?

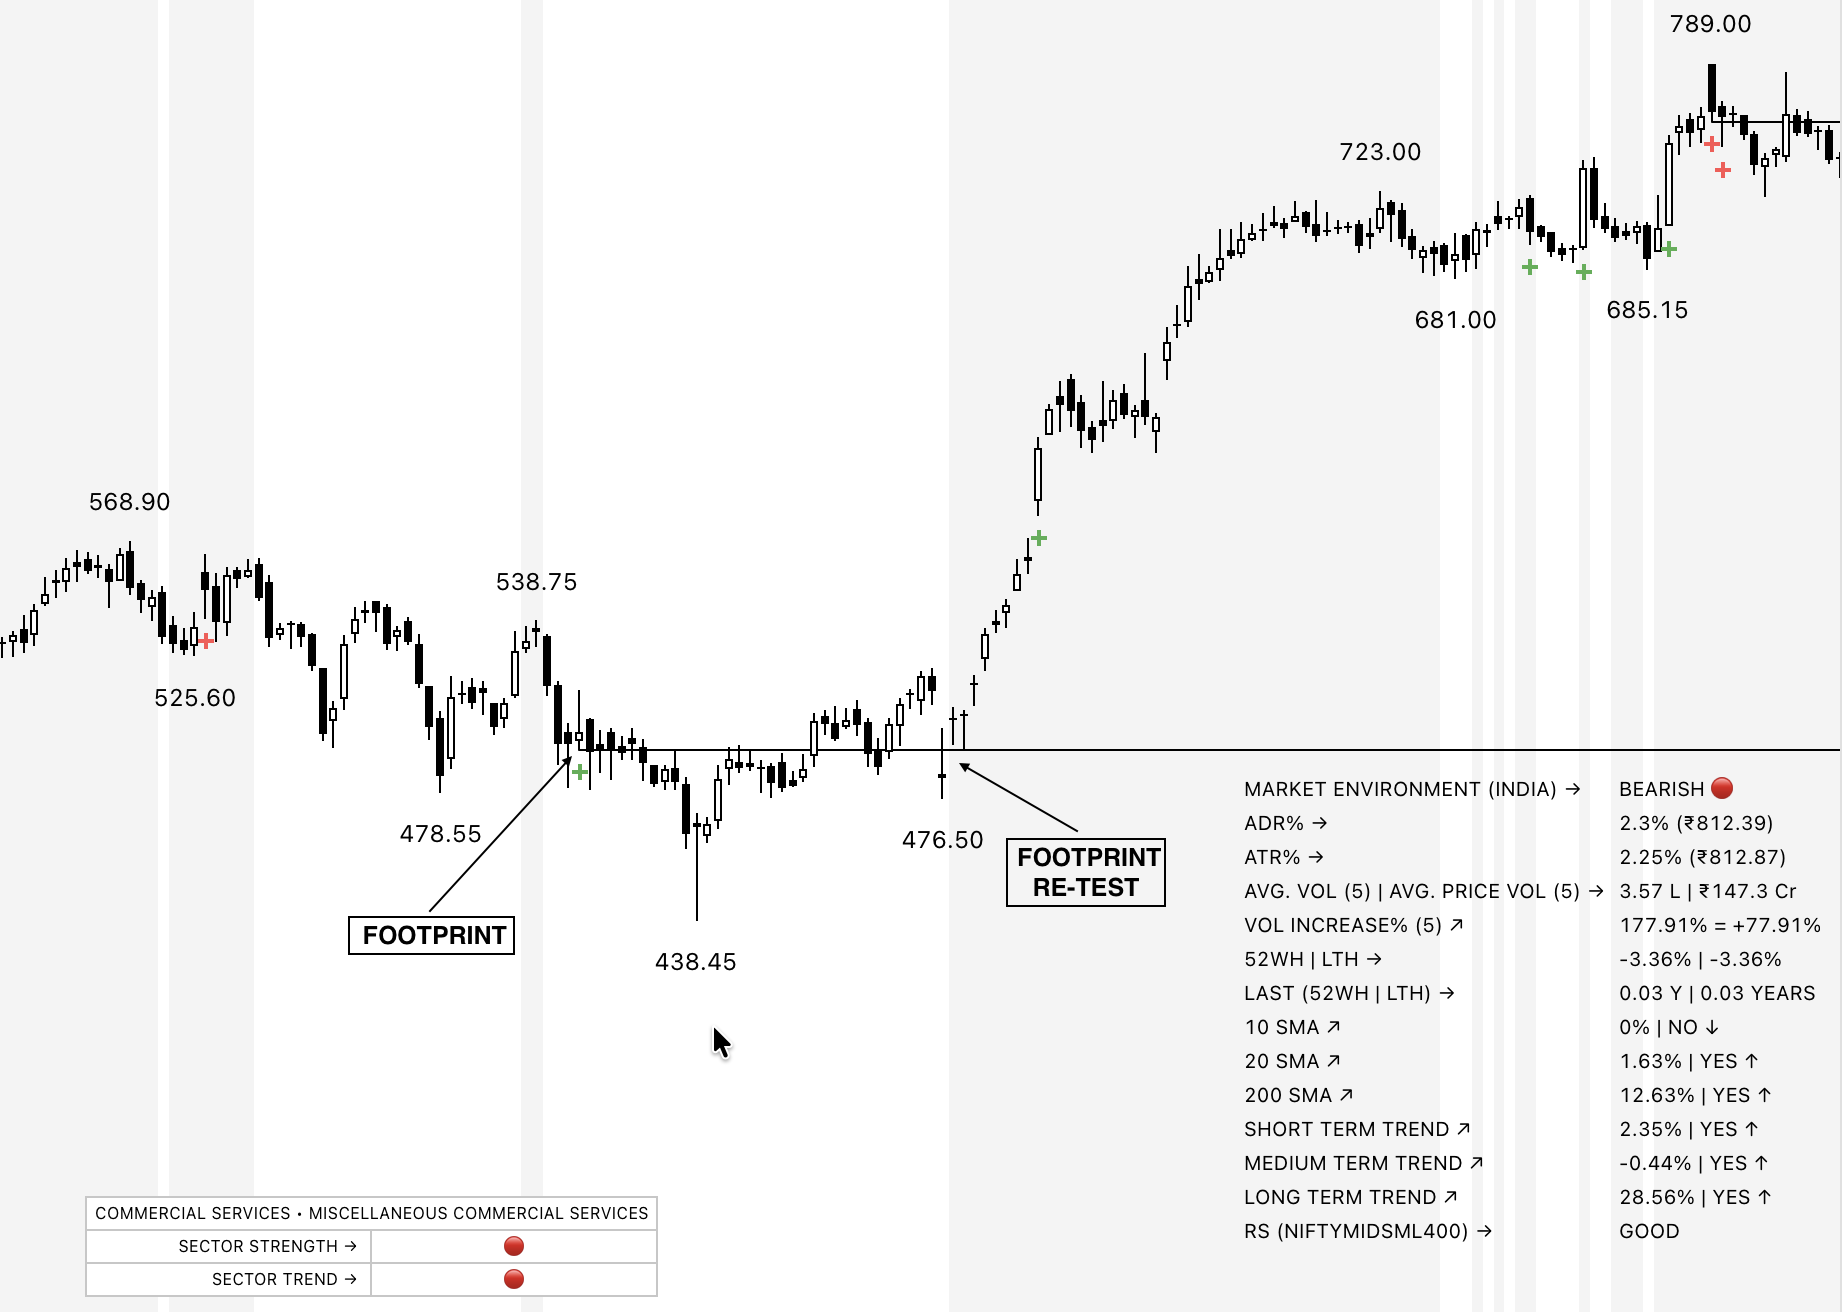
A footprint retest occurs when price returns to a high-volume institutional footprint zone after moving away from it. In simple terms:

  1. Big money enters
  2. Price moves away
  3. Price comes back
  4. Smart money either defends or abandons the zone
Your job as a trader is to assess what happens at step 4 — because that determines whether the trend is intact or at risk.

Why Footprint Retests Matter

Footprint retests are critical because they reveal real intention, not temporary noise. When price revisits a footprint:

  • If institutions defend → trend continuation likely
  • If institutions do not defend → weakness, distribution, reversal risk
This is information that retail traders almost never see — yet it’s the most honest signal in the market.

The Psychology Behind Footprint Retests

Markets move in phases. After institutions enter, price rarely moves straight up. Instead, it comes back to test:

  • Whether early sellers have finished
  • Whether liquidity is available
  • Whether demand still outweighs supply
This retest is not random — it’s strategic. Retail traders misinterpret this as “weakness.”
Professionals see it as validation. Because what matters isn’t the pullback —
It’s what happens at the pullback.

How Smart Money Behaves During Retests

When institutions truly believe in a position, they don’t panic on pullbacks. They defend the zone by:

✔ Absorbing remaining selling pressure You’ll see higher volume but stable price.
✔ Rejecting price quickly Wicks form, showing demand stepping in.
✔ Preventing breakdown of key lows Even if price dips, it recovers immediately.

But when institutions are not interested:

✘ Footprint zones break easily Price slices through a previously strong level.
✘ Volume collapses Participation dries up — no one defending.
✘ Lower highs start forming Distribution begins.

This is how footprint retests reveal the true story of a trend.


How VIV Makes Footprint Retests Visible

Traditional charts don’t show:

  • Which volume candles matter
  • Where institutional footprints lie
  • Whether big money defended their zone
This is why traders feel blind.

But VIV solves this exact problem. Here’s how VIV enhances your clarity:

1. VIV Marks Footprints Automatically Every significant volume candle (lifetime or 52-week high) is highlighted, and its high-low range becomes a permanent footprint zone. These are the zones that institutions care about.

2. VIV Keeps These Zones Visible Across Timeframes Even if the footprint was created weeks ago, VIV projects its importance forward — so when a retest happens, you see it instantly.

3. VIV Shows Whether the Zone Held or Failed When price revisits the footprint:
  • If defended → the footprint stays intact
  • If broken → VIV visually reveals the collapse of institutional interest
This is powerful because the market rarely gives such clear yes/no answers.

4. VIV Converts Hidden Behavior into Visible Confirmation You can see at a glance:
  • When smart money supports the move
  • When they abandon the move
  • When a trend is strengthening
  • When a trend is losing internal momentum
Footprint retests stop being confusion — they become your anchor of confidence.

How to Use Footprint Retests in Your Trading

Here’s the simplest framework:

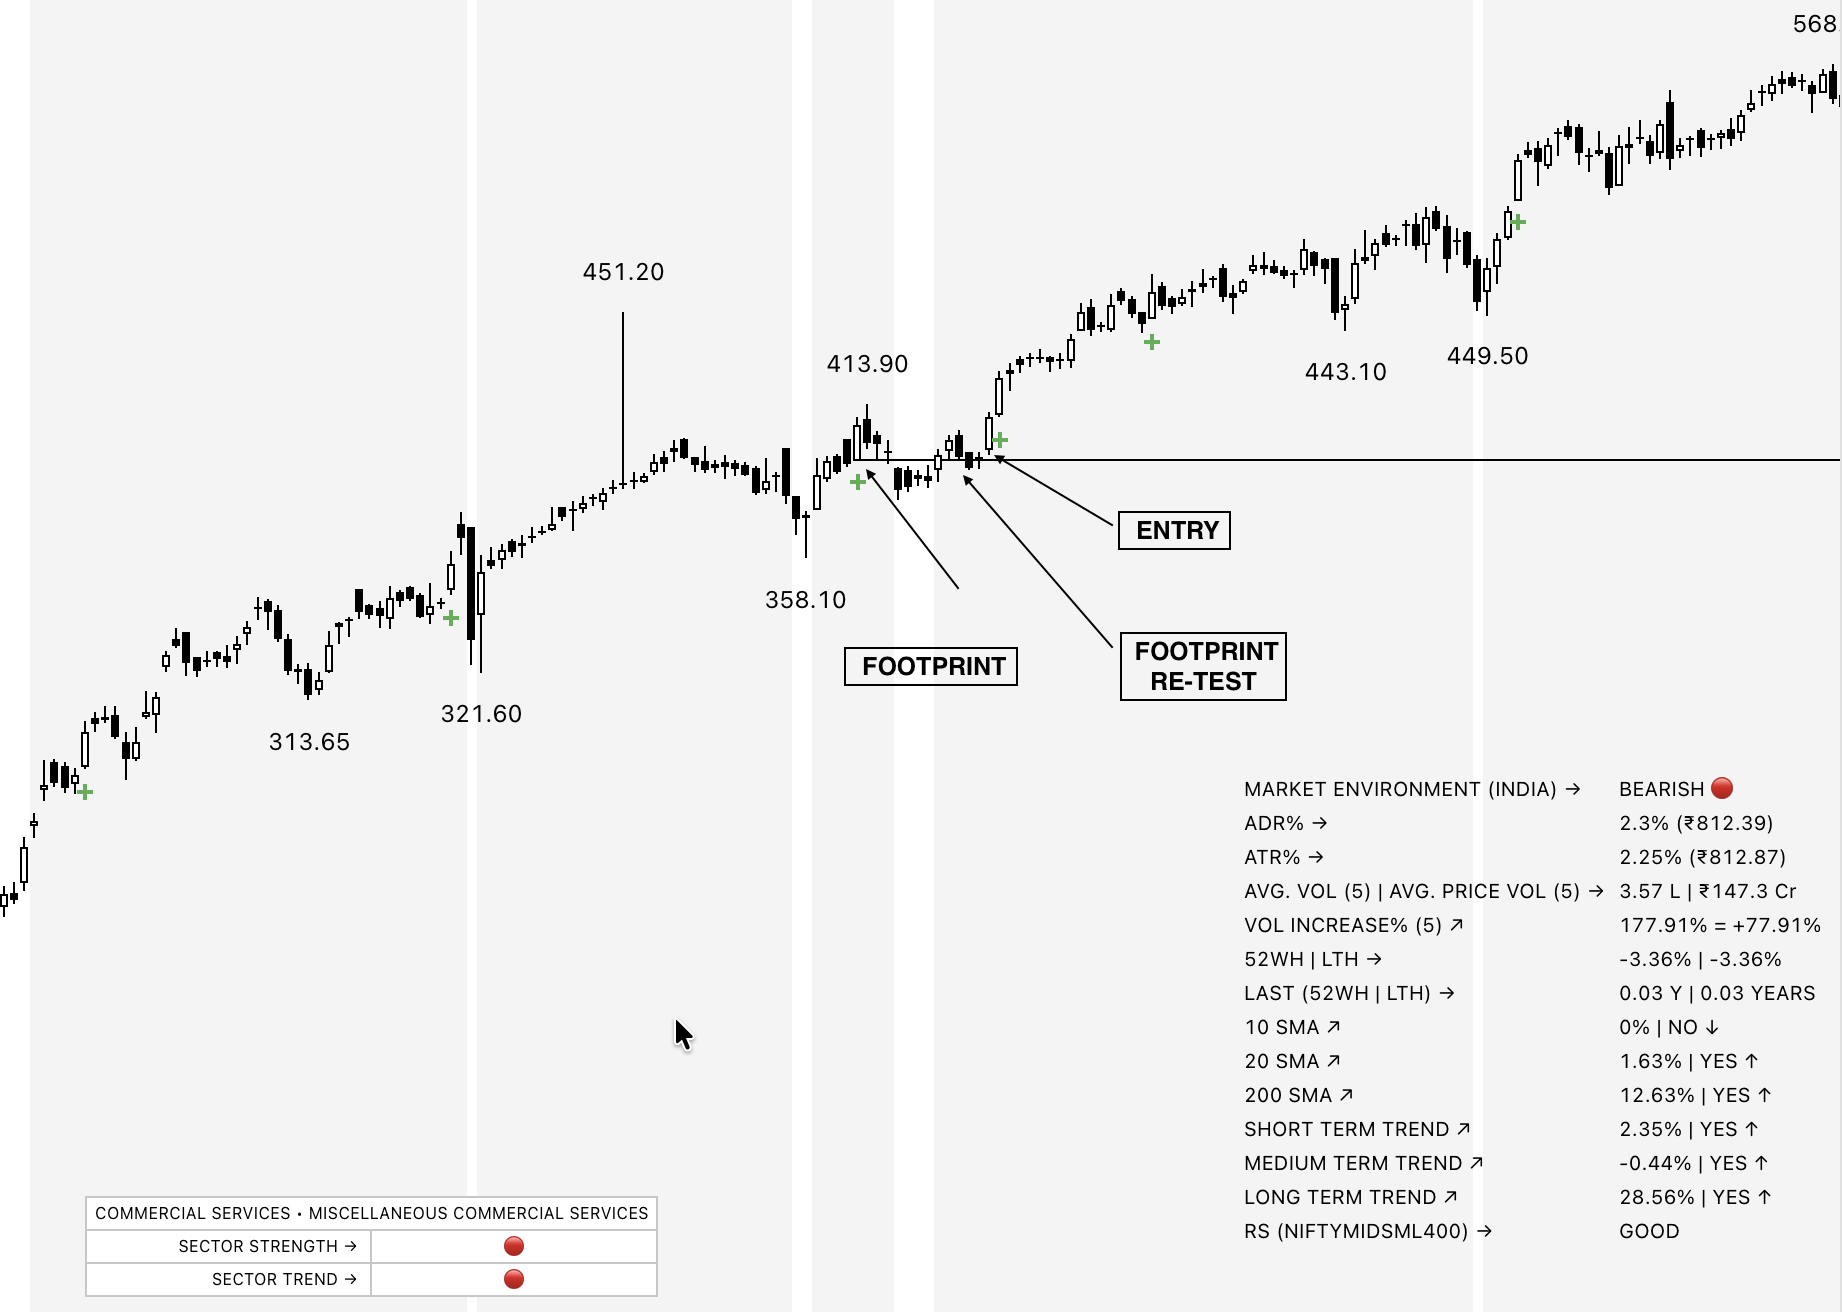
1. Identify the footprint zone using VIV Look for high-volume bars highlighted by the indicator.

2. Wait for price to revisit the zone
Retests always come — don’t chase breakouts.

3. Observe the reaction

  • Strong bounce → bullish continuation
  • Deep rejection wick → strong institutional defense
  • Break below with rising volume → weakness
  • Slow bleed through zone → smart money exit
4. Execute with clarity Once the reaction is clear:
  • Buy above the defending zone
  • Sell or exit if the footprint fails
  • Ride the trend if the footprint holds and breaks out again
This one rule alone can dramatically increase win rate and reduce whipsaws.

Example Scenario

A stock forms a high-volume candle at ₹1,200.
VIV marks this as a footprint zone.
Price rallies to ₹1,280, then pulls back to ₹1,200.

Now the key question:
Will smart money defend?

  • If price bounces strongly from ₹1,200 → trend confirmed
  • If price grinds through it → trend weakening
  • If price slices down with volume → major caution
Without VIV, this moment is invisible. With VIV, this moment becomes the clearest signal on the screen.

Conclusion

Footprint retests are one of the most reliable, honest forms of market confirmation. They reveal whether institutional conviction still exists — or whether it has quietly disappeared.

-Most traders see price.
-Very few see intention.
-VIV bridges that gap.

When you can read footprint retests with clarity:

  • You avoid weak trends
  • You hold strong trends longer
  • You filter fake breakouts
  • You stop guessing and start understanding
Footprint retests are where smart money speaks loudest — VIV simply helps you hear them.

X

By Sunil Sethi
Trading markets since 2016 | Swing & Positional trader | Price Action | Reversals
Building clarity in the chaos of charts — blending tech leadership with market mastery.

VIP - VERY IMPORTANT PERSON
VIV - VERY
IMPORTANT VOLUME
⇢ BE A VIP WITH VIV

See Automated Footprint Retests → Try VIV