There are no items in your cart
Add More
Add More
| Item Details | Price | ||
|---|---|---|---|

Every strong rally you’ve ever seen — every breakout that kept running while others faded — began long before it appeared obvious.
Behind that move was a phase where smart money quietly absorbed supply while retail traders grew impatient, confused, or even bearish.
This invisible process is called absorption — the hidden buildup of institutional positions beneath the surface of price. It’s not flashy, but it’s powerful. It’s where the next big move is born.
Absorption occurs when strong hands (institutions) buy heavily into weakness, quietly taking the opposite side of emotional selling.
During this phase, price doesn’t fall — even though volume remains high. That’s the key:
“When volume is heavy but price refuses to drop, someone is absorbing the selling.”This isn’t random. It’s deliberate accumulation — professional traders preparing for the next phase while the crowd sees “nothing happening.”
The crowd hates boredom.
Sideways movement, small candles, and tight ranges make retail traders exit positions, thinking “the move is over.”
That’s exactly what smart money wants.
They buy when interest is lowest, absorbing every bit of supply.
You’ll often notice:
Traders often confuse absorption with accumulation — but they’re not identical.
| Feature | Accumulation | Absorption |
|---|---|---|
| Phase | Early stage after a downtrend | Mid-to-late stage before breakout |
| Price Action | Broad range, back-and-forth movement | Tight range, controlled and stable |
| Volume | Periodic surges | Consistent, high volume |
| Behavior | Building positions | Final soaking up of remaining supply |
Absorption is the final handshake between sellers and buyers before the next leg begins.
If you’re analyzing charts without any indicator, look for these signs:
Absorption doesn’t happen randomly — it’s a structured play: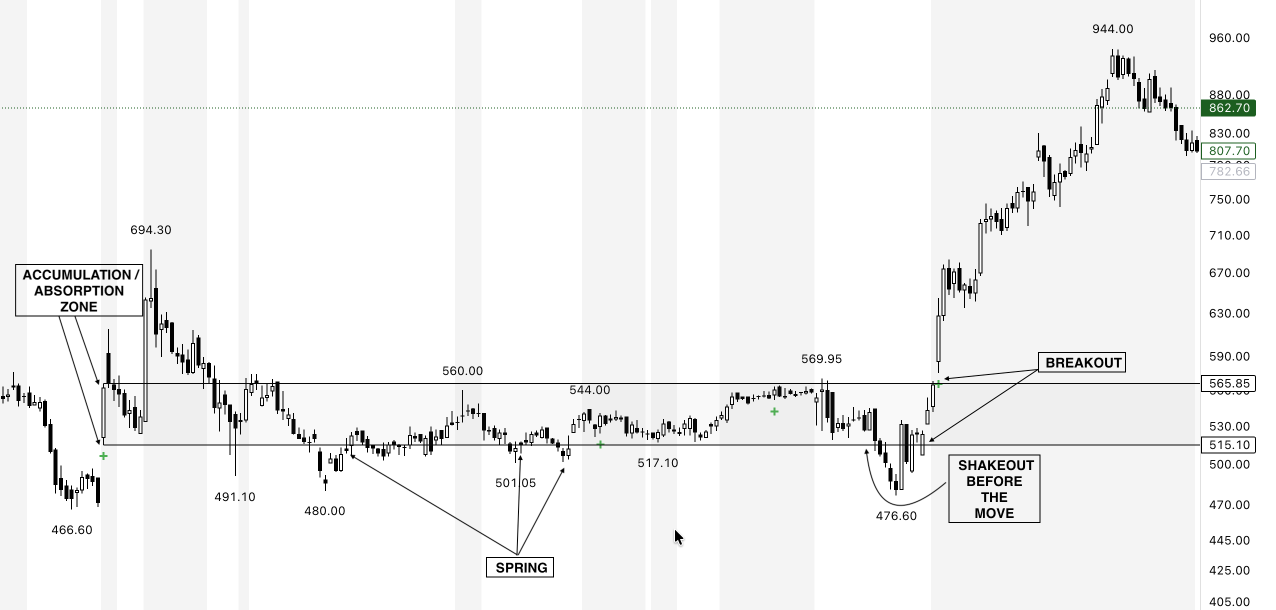
This is where VIV (Very Important Volume) transforms how traders read the market. VIV doesn’t just measure volume — it identifies where that volume matters most.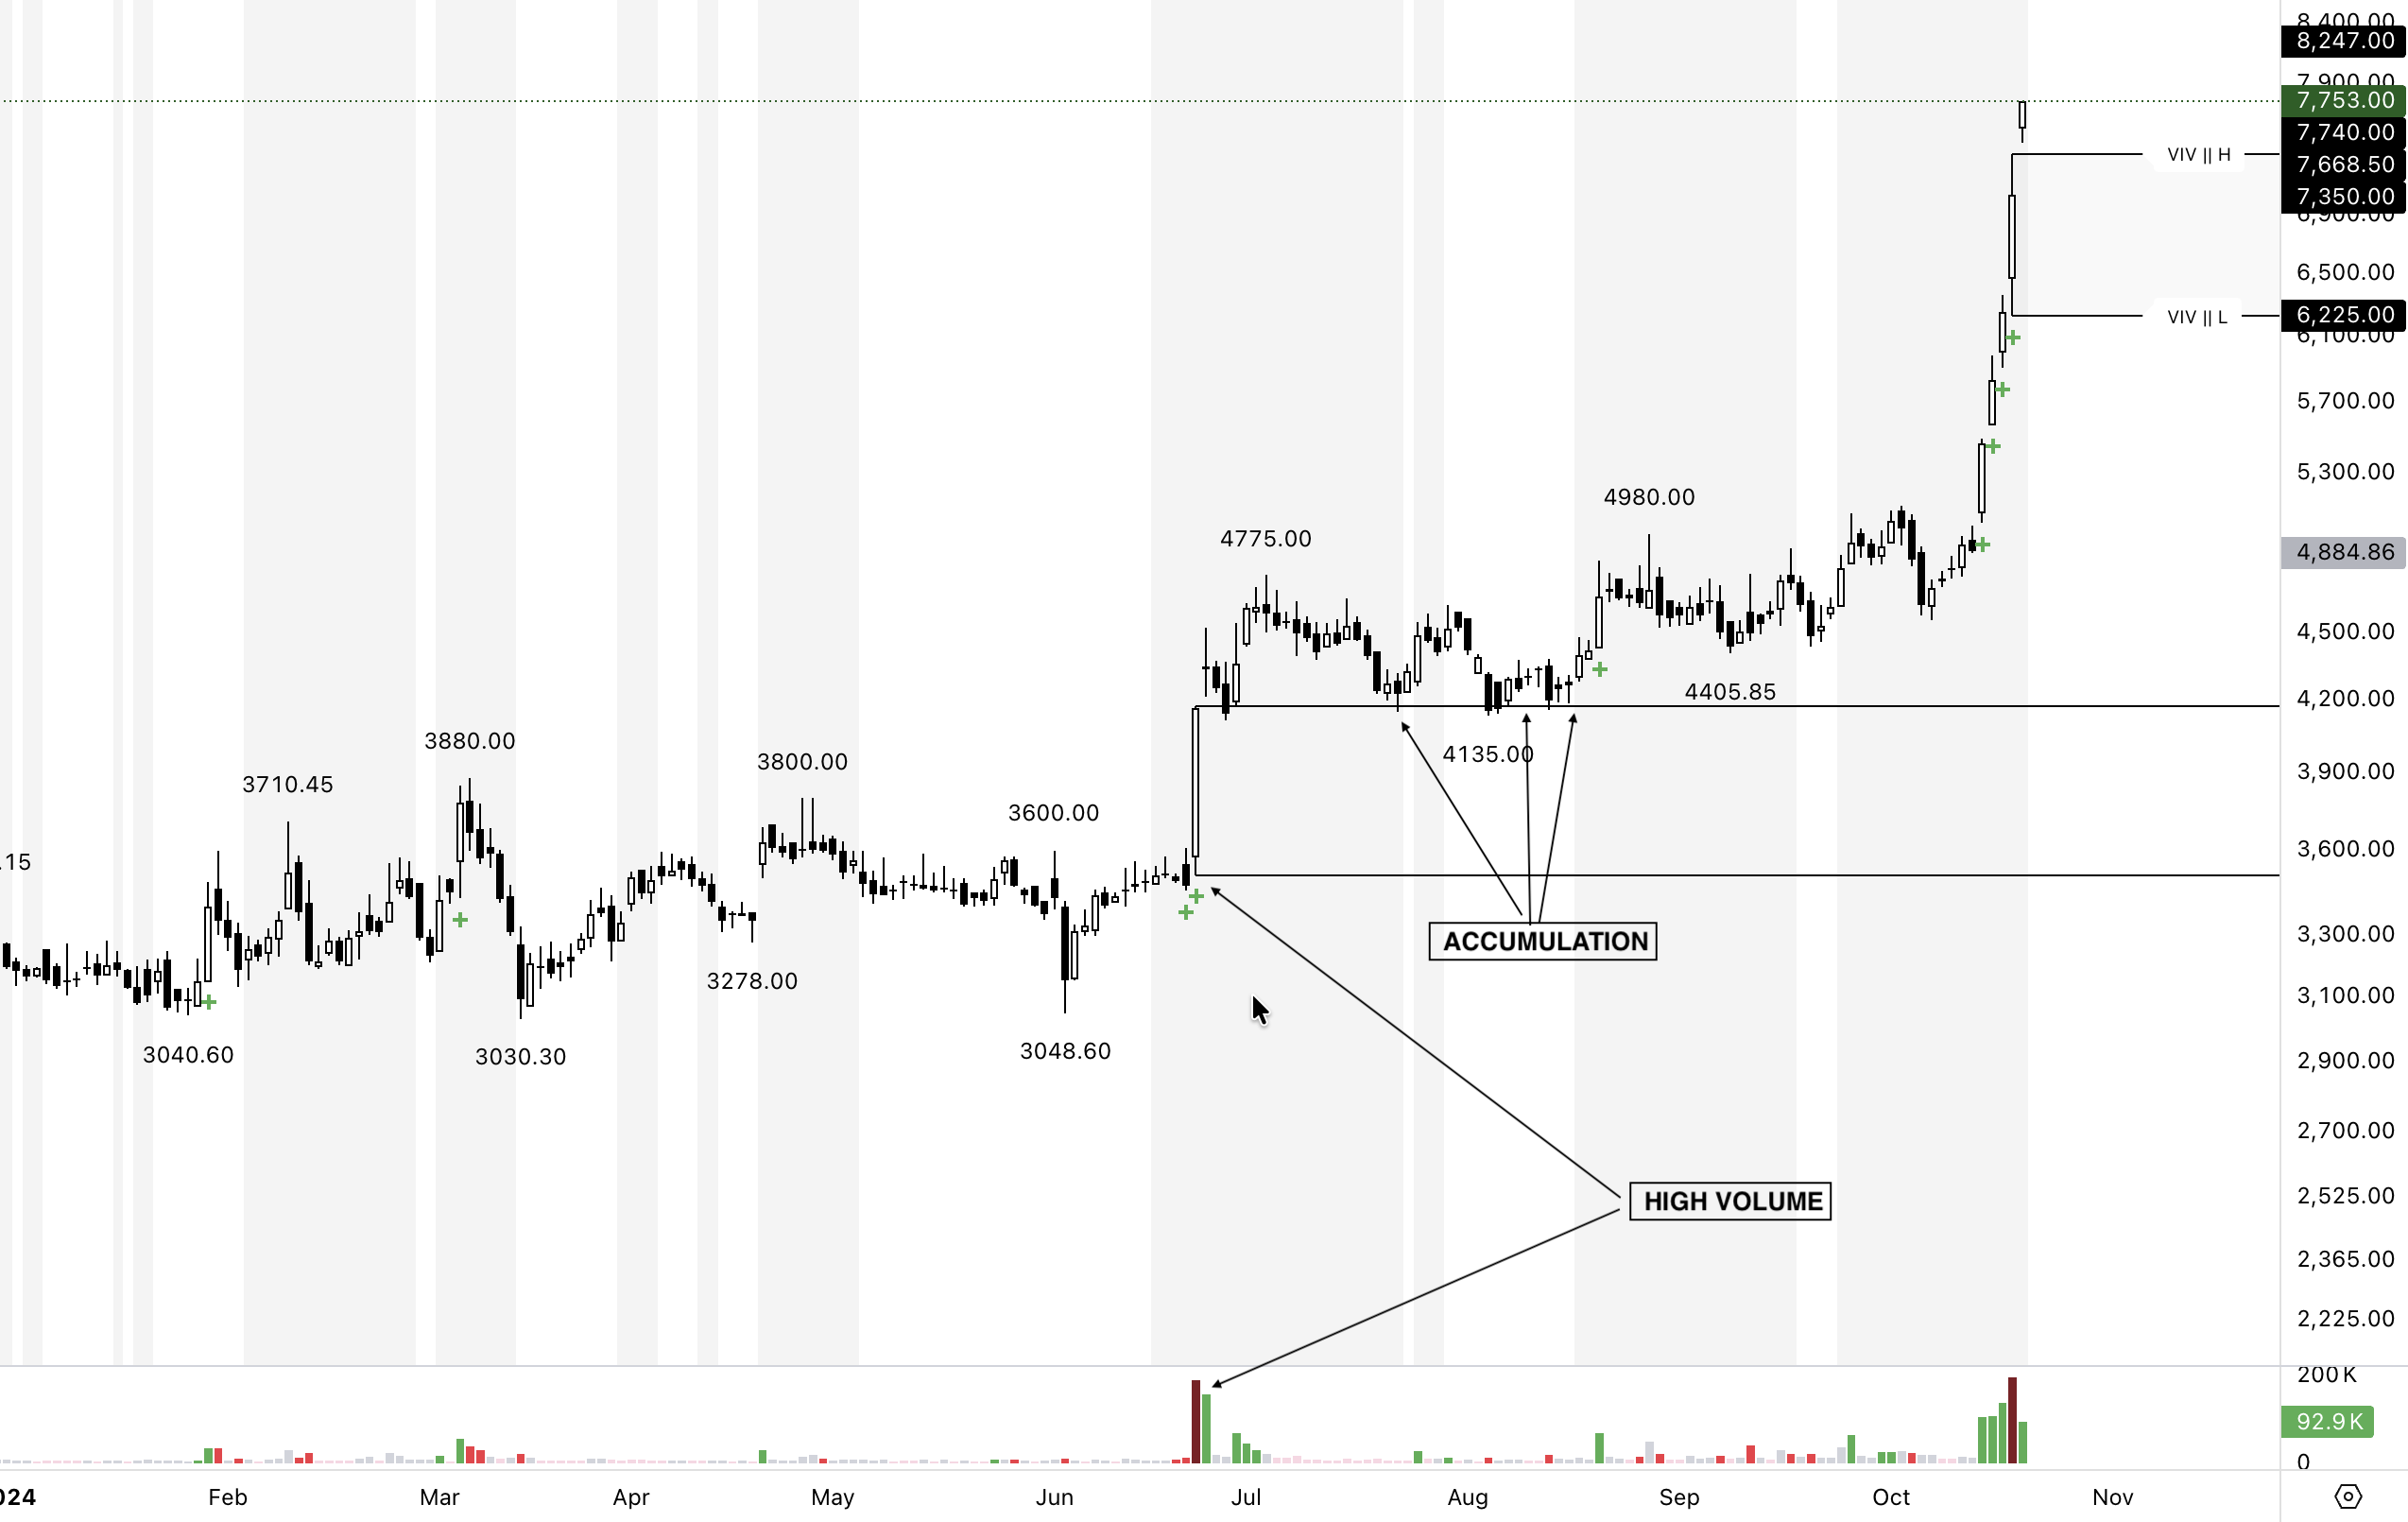
During absorption phases, it:
Imagine a stock trending downward for weeks, suddenly stabilizing between ₹480–₹500.
Each dip to ₹480 sees high volume — but price never breaks lower.
Days later, it breaks ₹500 with conviction and never looks back. That ₹480–₹500 zone was not random support — it was absorption. Smart money quietly built positions while everyone else gave up.
With VIV, those footprints — those exact high-volume candles — would be visible. You’d know the story before the breakout, not after it.
Absorption zones are the birthplace of momentum.
Traders who identify them early position before the move.
Traders who ignore them end up chasing.
Absorption is the calm before the storm — the silent phase where conviction builds while the crowd grows tired. When you learn to spot this phase, you begin to trade like institutions — with patience, precision, and purpose.
The VIV Indicator reveals these footprints automatically, so you can see where demand quietly overtakes supply before the chart explodes.
Big moves don’t start with noise — they start with absorption.
And those who can see it early shape their own destiny in the market.

By Sunil Sethi
Trading markets since 2016 | Swing & Positional trader | Price Action | Reversals
Building clarity in the chaos of charts — blending tech leadership with market mastery.